Weekly Market Outlook - An Unsurprising (and Untroubling) Pullback
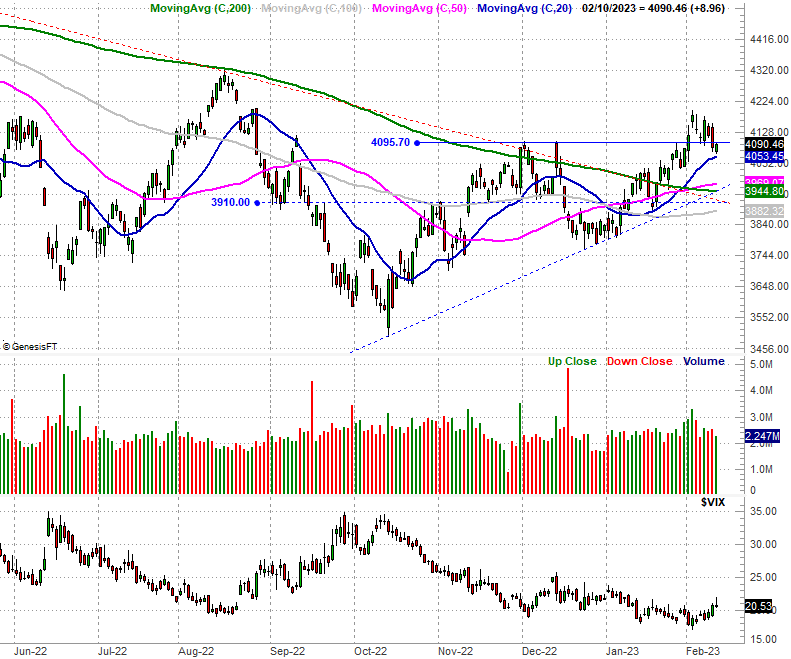
Technically speaking, last week was the worst week in a while. On the other hand, the lousy week follows a heroic start for the year. The S&P 500 is still up 6.5% since the end of 2022 despite last week's 1.1% slide. More than that though, the index -- all of the indexes, actually -- are still above critical support levels.
We'll show you exactly why the budding bull market is still well intact in a moment. First though, let's preview the big economic announcements in the lineup for this week.
Economic Data Analysis
As was mentioned a week ago, the calendar was a bit unusual last week -- there were no major economic announcements to analyze. The pace starts to pick up from here.
Economic Calendar
Source: Briefing.com
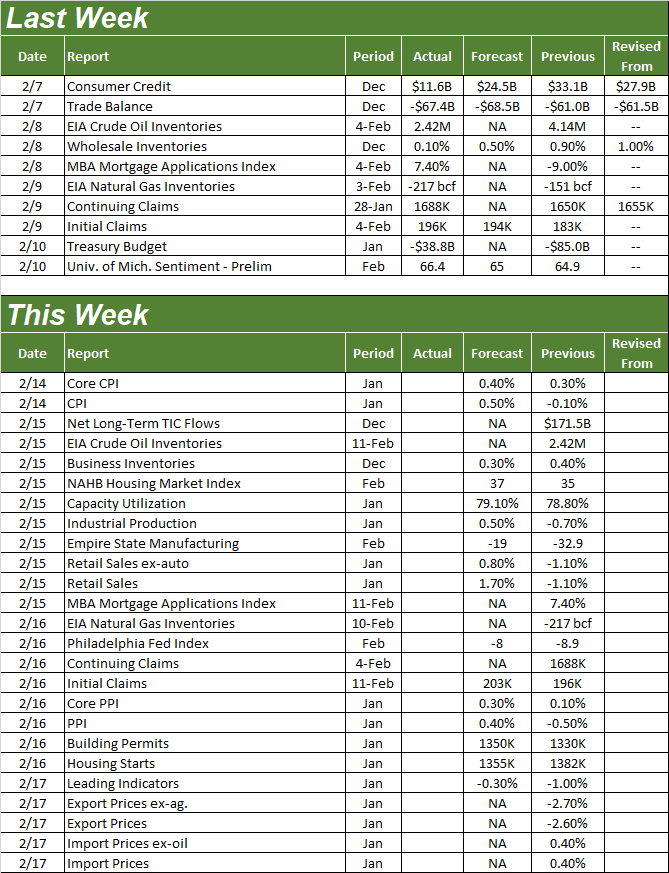
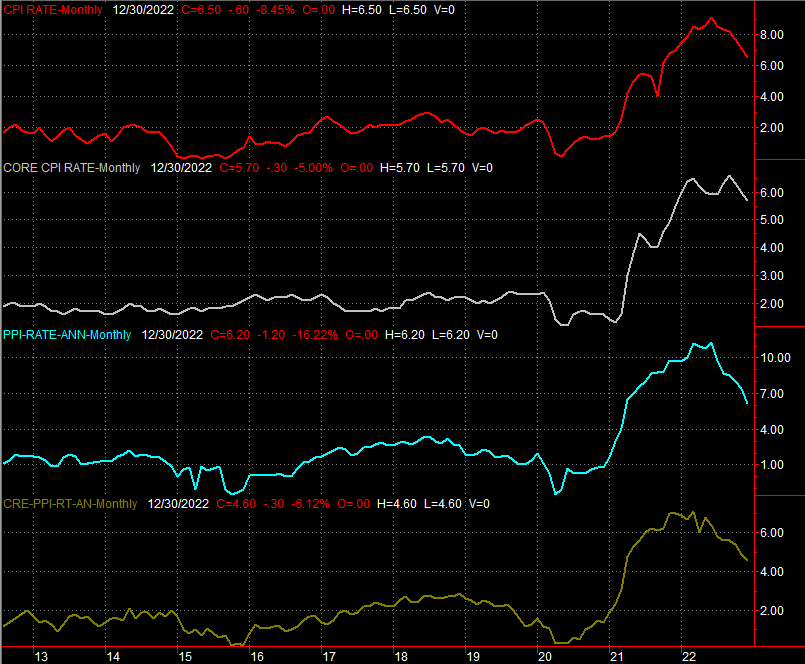
This week's pretty well loaded. The party starts in earnest on Tuesday, with a look at last month's consumer inflation report. That data is rounded out on Wednesday with January's producer price inflation figures. While inflation is still brisk, it has been slowing down. Economists don't think that relief is set to last though. They're modeling a bit of an uptick for last month, in fact, giving the Federal Reserve enough of a reason to keep moving forward with rate hikes.
Inflation Rate Charts
Source: Bureau of Labor Statistics, TradeStation
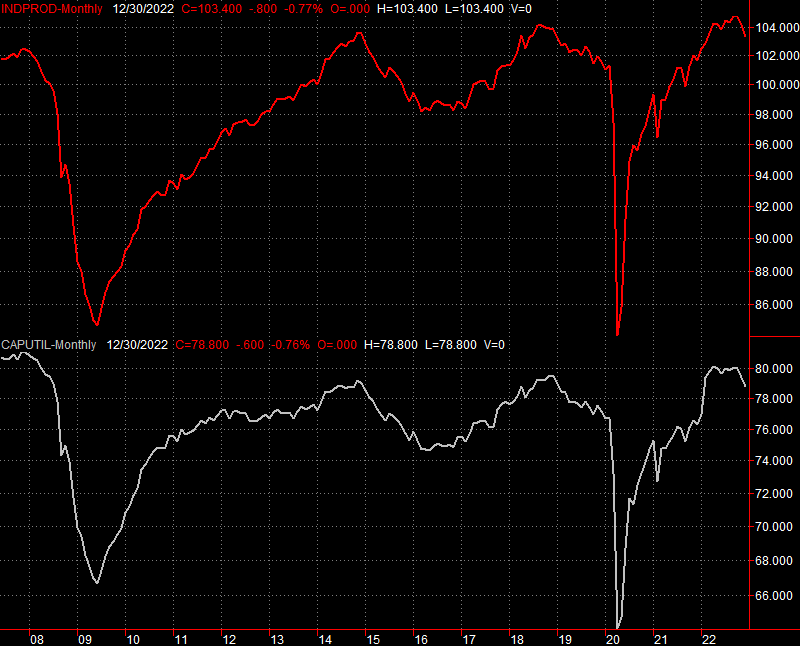
On Tuesday we'll hear January's capacity utilization and industrial production figures from the Fed. December's numbers were anything but thrilling. Forecasters are calling for a slight improvement this time around, but even then, the bigger-picture trend is tilted towards weakness. A decent report this time around still might not be a major victory.
Capacity Utilization, Industrial Productivity Charts
Source: Federal Reserve, TradeStation
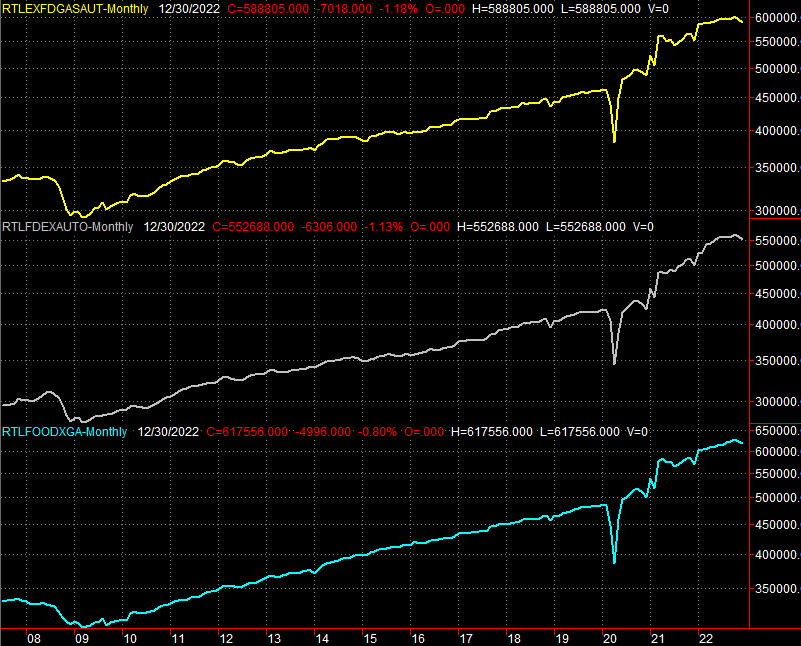
We'll also get January's retail sales data on Tuesday. Consumer spending fell quite a bit a month earlier, for a second month in a row. We should see a decent bounceback this time, but a failure to make this progress will be another pointer to economic weakness.
Retail Sales Charts
Source: Census Bureau, TradeStation
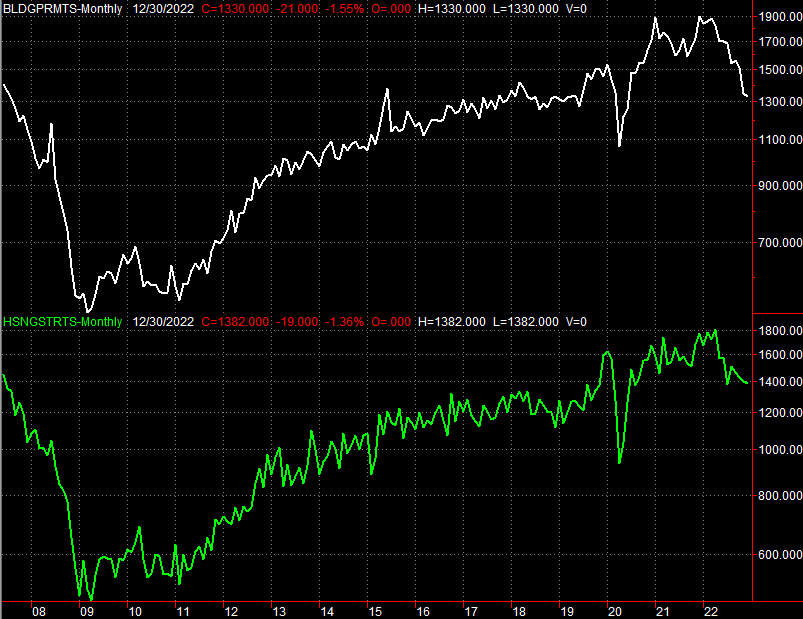
Lastly, on Thursday look for last month's housing starts and building permits. Like prices and purchases, new home construction has been dwindling since early last year. Economists believe last month's numbers will be roughly in line with December's. Even so, that's a relatively poor set of numbers. Anything below expectations could prove problematic for stocks. That being said, a slight cooling in interest rates has reignited decent demand for new mortgage loans. Don't be shocked to see fresh strength on this front.
Housing Starts and Building Permits Charts
Source: Census Bureau, TradeStation
Stock Market Index Analysis
Last week was a loser, but that's not necessarily a bad thing. Stocks have -- or had -- rallied rather quickly from their late December low, and that buying turned frenzied early this month. It's better to cool the effort off a bit before it races out of control, setting up a major pullback that can't be contained.
And yes, this one was contained. Take a look at the daily chart of the S&P 500 below. It pulled back below the ceiling at 4096. Other than that though, it remains above all of its key moving average lines, and well above a huge converge of support around 3900. In fact, the S&P 500 didn't even slide below its 20-day moving average line (blue) at 4053 despite last week's lull.
S&P 500 Daily Chart, with VIX and Volume

Source: TradeNavigator
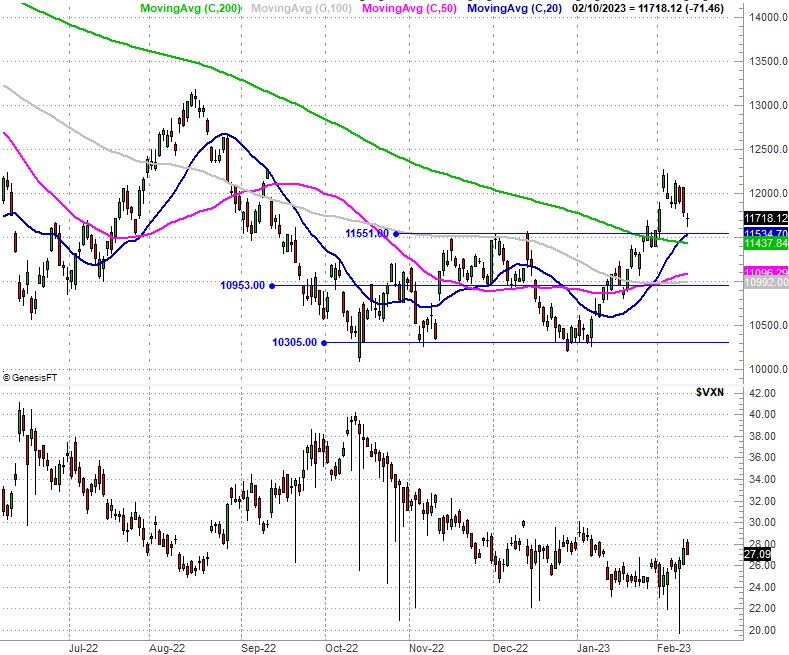
The NASDAQ Composite fared just as well. Even though it lost 2.4% over the course of the past five trading days, it remains above its 20-day moving average line (blue) at 11,535 as well as the 200-day moving average line (green) at 11,437. The recovery effort remains more than intact enough to be readily renewed.
NASDAQ Composite Daily Chart, with VXN
Source: TradeNavigator
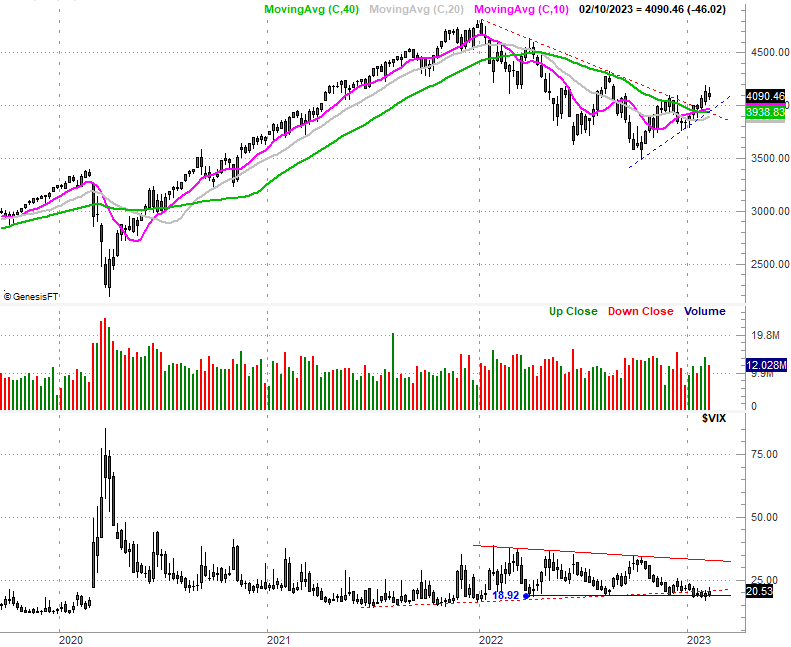
Backing out to a weekly chart of the S&P 500 adds some perspective to the week. As we can plainly see here, the breakout thrust from four weeks back still leaves the index above the falling resistance line (red, dashed) that had been guiding it lower since early last year. Also notice, however, the S&P 500 is now standing on a so-called "golden cross"... where the 50-day moving average line crosses above the 200-day line. This technical event suggests a major turning of the momentum tide.
S&P 500 Weekly Chart, with VIX and Volume
Source: TradeNavigator
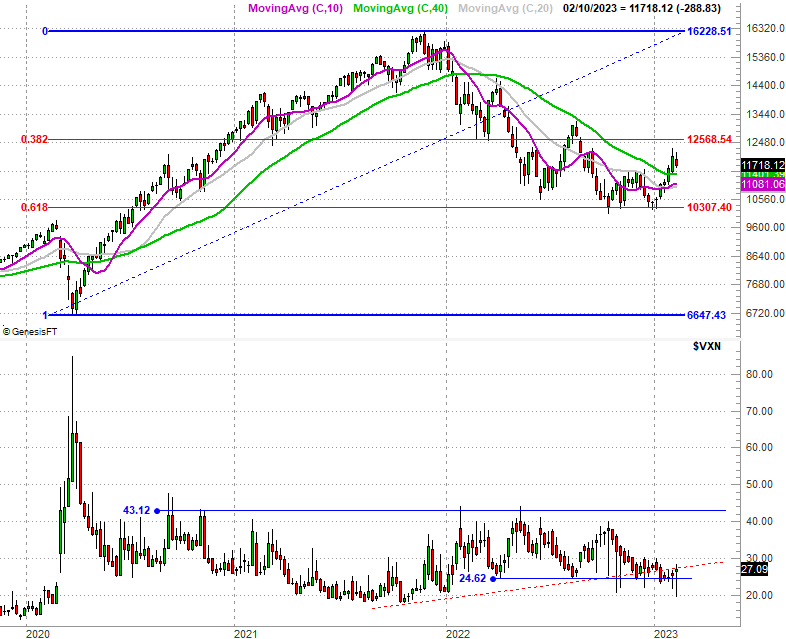
It's perhaps the weekly chart of the NASDAQ, however, that offers us the best explanation of last week's slowdown.
We've discussed Fibonacci lines in the Weekly Market Outlook before, so we won't belabor their basis and importance again now. We'll simply say that Fibonacci lines tend to be natural, "organic" support and resistance levels for stocks and indexes.
To this end, note that the composite should start to be feeling some pressure here. It didn't quite test the 38.2% Fibonacci retracement line at 12,568 a couple weeks ago, but it doesn't have to touch it exactly. Simply being near that mark may be enough. Either way, we can and should expect the NASDAQ to bounce around between the two key Fibonacci retracement lines at 10,307 and 12,568 for a while before moving outside of this containment range. That's not a bad thing though. It would be better for the rally effort to establish some sort of technical base -- by virtue of just moving sideways for a while --before attempting the next leg of this budding bull market.
NASDAQ Composite Daily Chart, with VXN
Source: TradeNavigator
Bottom line? Don't panic if this week is another weak (or even bearish) one. There's room for a little bit of weakness here without breaking the new bull market's back. In fact, the advance probably should cool off a little more before being restarted, if we want it to be sustained while stocks ease into their likely forward-looking valuations. Fundamentals are ok here, but they're not stellar.
