As of Monday, the market still had a fighting chance at bouncing back from its recent weakness before slipping into a heap of trouble. After Tuesday’s drubbing though, the market’s in much more serious trouble.
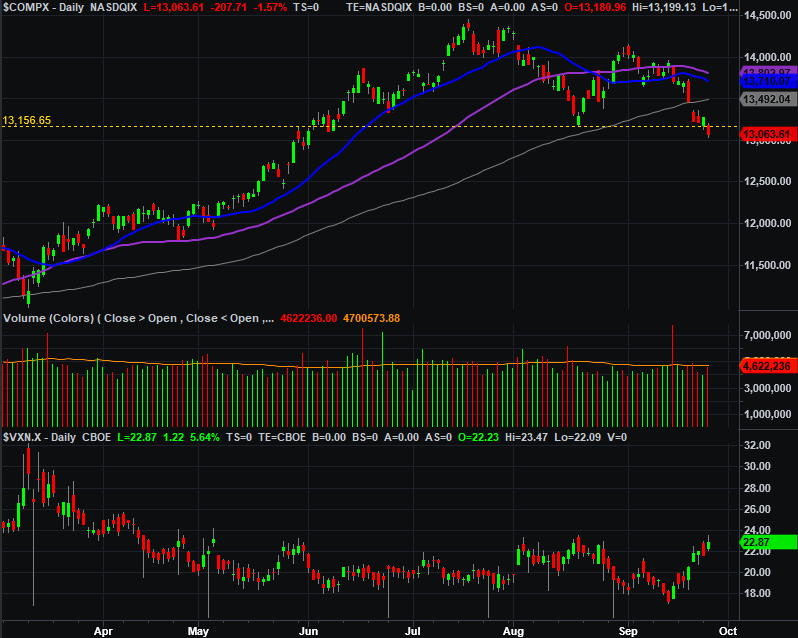
The daily chart of the NASDAQ Composite illustrates part of the reason why. On Monday it looked as if last month’s low of 13,157 (yellow, dashed) would continue serving as a floor; the index even pushed up and off of it to make Monday’s low. Today’s selloff, however, dragged the NASDAQ decidedly below that level.
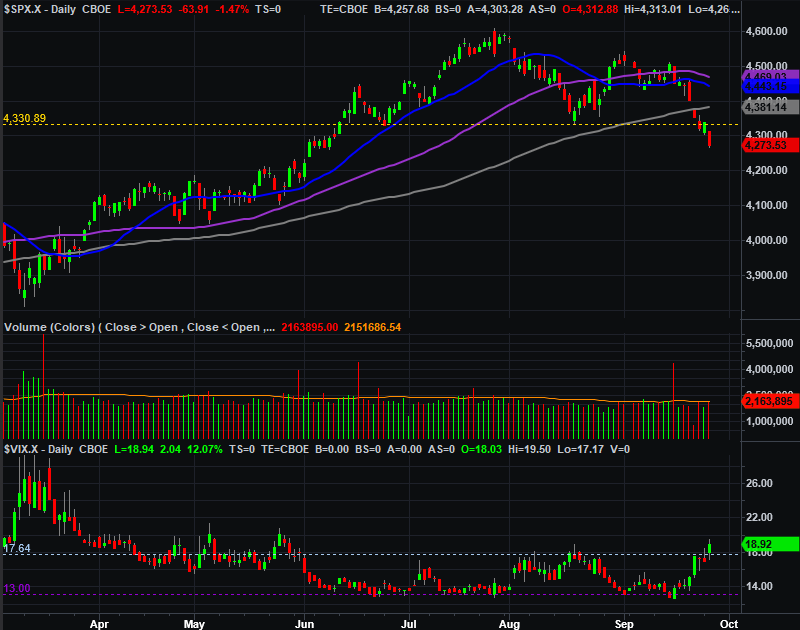
The S&P 500 had already broken under its comparable floor late last week, so it only widened that gap on Tuesday. The daily chart of the S&P 500 is still showing us something new and concerning though. Its volatility index (or VIX) is starting to move higher. That’s usually the case when the market itself is moving lower. In this particular case, however, the VIX is making its way higher in a more decisive way, punching through last month’s peak after pushing up and off of a floor at 13.0.
The weekly chart of the S&P 500 puts the VIX’s new uptrend in more perspective. This chart also shows us how far the VIX could climb before bumping into a technical ceiling that would coincide with a market bottom. That ceiling’s well into the 30’s.
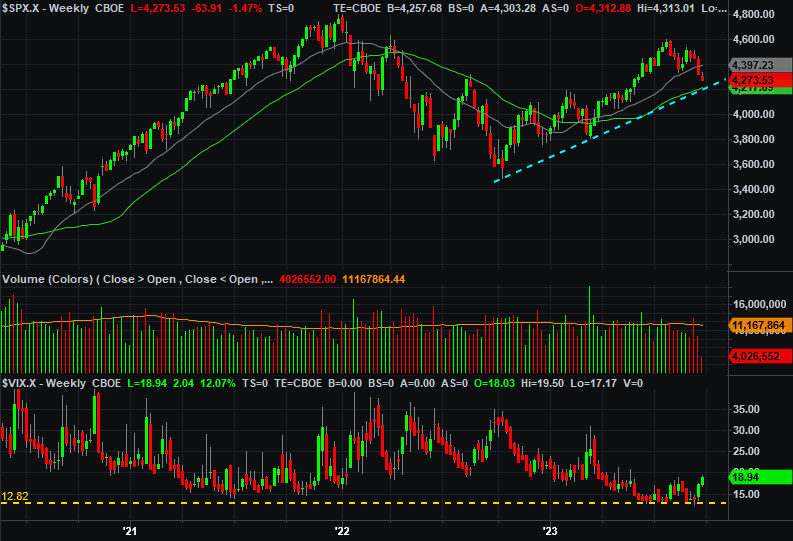
This same weekly chart also offers a glimmer of hope. That is, there’s support not too far below where the S&P 500 is right now. The 200-day moving average line (green) at 4195 more or less lines up with straight-line support (dashed) going all the way back to last October’s low, and connecting that to March’s low. If more selling is in the cards, the bears will certainly get some pushback there.
Even so, that doesn’t inherently guarantee any pullback will be halted there… just tested.
But, first things first. The only certainty to be voiced following Tuesday’s setback is that an important technical floor has been broken, and a volatility index’s ceiling has been breached. The NASDAQ Volatility Index’s (VXN) resistance level at 23.2 [not plotted on out chart above] is also being tested, and could just as easily be broken as soon as tomorrow.
With each one of these lines being crossed, the broad market moves deeper and deeper into trouble.
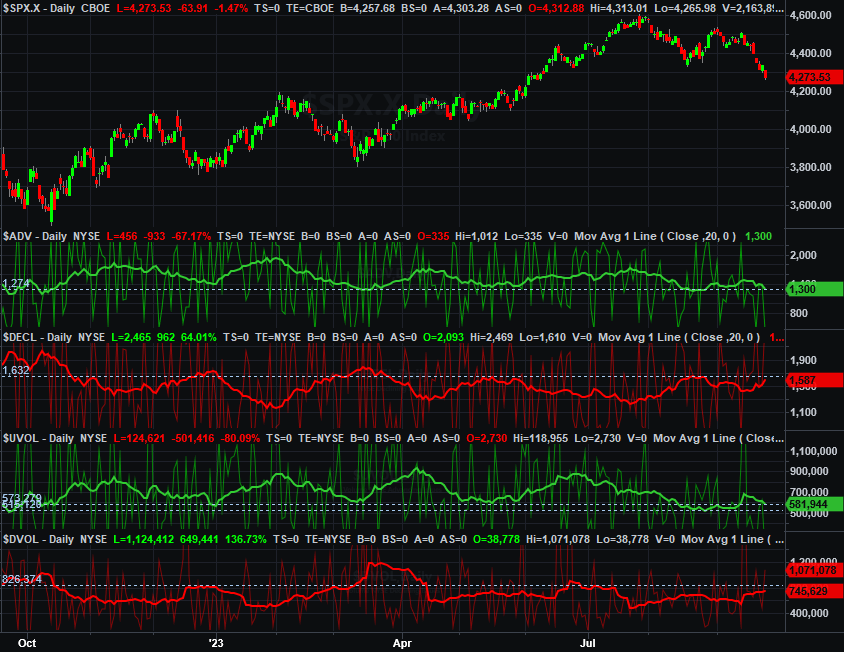
The kicker: Breadth and depth are now turning decidedly bearish as well. The S&P 500’s average daily advancers is now back to last month’s multi-month low, while its average daily decliners is near last months multi-month high. Meanwhile, average “up” volume is about to slide back to multi-month lows, and the S&P 500’s average “down” volume is perking up again, en route to August’s high levels.
Net-bearish depth and breadth suggests that the market isn’t just drifting lower. It says traders are participating in the move, making it happen. This can be interpreted as a picture of what they’re thinking, even if they’re not saying it.
Whatever the case, it’s clear that the stock market is increasingly on the defensive here. Plan accordingly.