Toll Brothers Earnings Preview: Key Support Must Hold on a Dip
-- Toll Brothers stock will be in focus on Tuesday evening when it reports earnings. Here are the key levels to know right now. --
By Bret Kenwell, TheStreet.com
Toll Brothers TOL is off a bit on Tuesday, down just over 1% at last check ahead of the luxury-home builder's earnings report after the close.
Investors will have their eye on this stock, as the company gives us a glimpse at the housing market.
The report will have implications for Lennar (LEN) and KB Home (KBH) as well. Depending on management's commentary, it may also affect home-improvement retail chains Home Depot (HD) and Lowe's (LOW).
Mostly, investors will want to know how inflation and the Fed's interest-rate hikes are affecting the homebuilding industry.
While Toll Brothers stock has had a nice run off the 52-week low it made in October, the shares remain lower by almost 40% from their one-year high.
Let's revisit the chart ahead of its quarterly results.
Trading Toll Brothers Stock
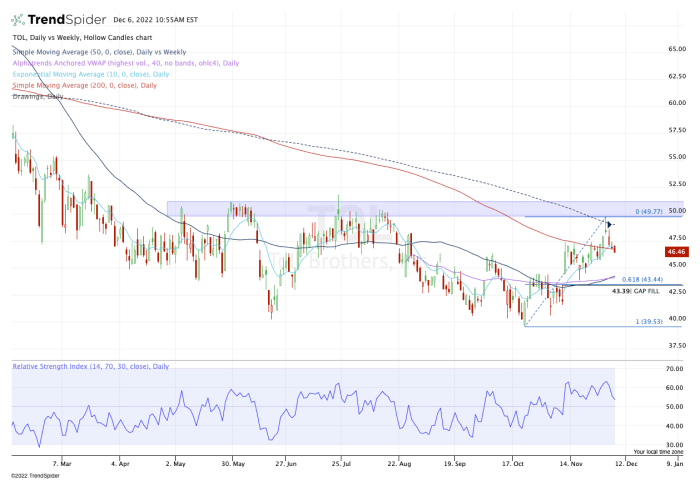
Daily chart of Toll Brothers stock
Chart courtesy of TrendSpider.com
Two levels stand out very clearly when I look at the daily chart of Toll Brothers stock.
On the upside, the $50 area has been resistance. On the downside, the bulls want to see the $43.50 to $44.50 area hold as support on a pullback.
Starting with the latter, watch four major measures in that zone.
Around $43.40 we find the 61.8% retrace of the current range, as well as an open gap. Just above those two measures we also find the 50-day moving average and the daily VWAP measure.
Combined, these four measures will play a key role if there's a bearish earnings reaction in Toll Brothers stock.
If the stock dips to this area and fails to hold it as support, it shows traders that the stock is not willing to hold a key area. That could open the door down to $41.50, then potentially down to the $39.50 to $40 zone.
On the upside, the 50-week moving average was recently resistance. But the $50 to $51 area has been resistance now for multiple quarters.
Should we see an upside reaction to earnings, keep an eye on the 50-week moving average and the $50 to $51 area. A breakout could open the door to $55.
From TheStreet.com