Target Stock Has Slumped in '23. Does the Chart Signal a Turnaround?
-- Target stock has not traded well this year, but the bulls are looking for the earnings report to give it some life. --
By Bret Kenwell, TheStreet.com
Target (TGT) shares were lower in Wednesday's premarket trading after the retailer reported first-quarter earnings before the open.
The stock opened lower too, but it turned higher, up 2.5% at last check.
The report was mixed, but the longs are making the best of it. That's not unlike what we saw with Home Depot (HD) on Tuesday, when it reported a mixed quarter and disappointing full-year guidance.
Target delivered a top- and bottom-line beat, although the sales -- up 0.4% year over year -- barely topped expectations. Theft continues to play a large role in Target's bottom-line results.
Further, management delivered a disappointing second-quarter earnings outlook, and an only slightly less disappointing full-year outlook.
The shares are down more than 25% so far this year and remain lower by 31% over the past year.
All that said, could today's action indicate that the bad news has been priced in?
Let's look at the charts for a clue.
Trading Target Stock on Earnings
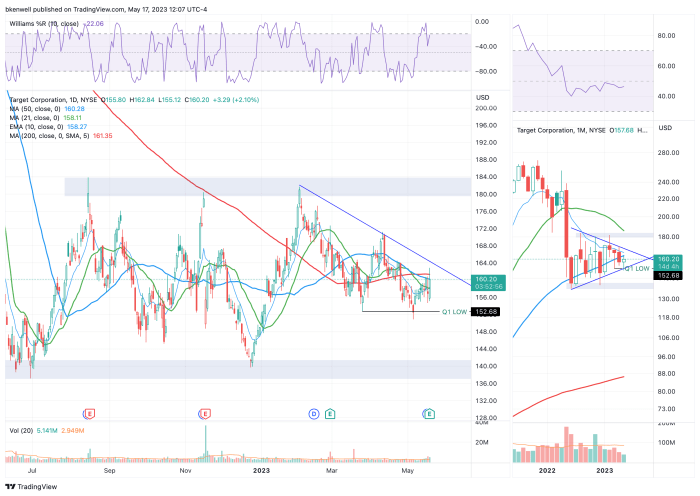
Daily chart of Target stock (left), monthly chart (right)
Chart courtesy of TradingView.com
Shares of Target sharply declined but have been consolidating in a wide range between $140 and $180.
That range has been in effect since June and is highlighted on the daily chart (on the left). The current wedging pattern can be seen on the monthly chart (on the right).
More recently, TGT shares have been holding the low-$150s as support, while downtrend resistance continues to squeeze them lower.
With today's action, Target stock is trying to regain its major daily moving averages, the 50-day and 200-day.
If it can take out today's high of $162.84, then we could see a push into downtrend resistance (blue line).
If the stock gets past this area - which includes the 61.8% retracement of the current range - the door could open to the April high near $171.25. If we get a daily close above that, and thus a monthly-up rotation, the bulls will likely turn their attention to the $180 area.
Conversely, if Target can't regain its daily moving averages, $155 will be on watch on the downside. A move below this level puts this month's low in play at $150.87. Below $150 likely gets sellers aiming for the low-$140s.
Here's the bottom line: Watch the 50-day and 200-day moving averages and the $163 to $164 area. If Target stock can't regain these measures, it remains vulnerable.
From TheStreet.com