Rocket's Been Explosive but Its Chart Reveals the Volatility

- Rocket Cos. has been explosive over the past few days but volatility is a knife that can cut both ways. Let's look at the chart -
By Bret Kenwell, TheStreet.com
Rocket Cos. (RKT) has been a wild one over the past few days.
On Friday, shares popped higher on earnings before slipping lower into the close, although the stock still ended higher by almost 10% as it faded from resistance.
Then on Monday shares popped again, giving a further test into resistance but closing strong on the day after an 11.2% gain.
The solid quarter was in addition to the $1.10 a share special dividend the company announced, which follows the $1 billion buyback plan announced in November.
Fireworks were prepped and ready on Tuesday, with shares erupting 71% on the day despite triggering multiple trading halts during the session.
The recent rally is being compared to the Reddit short squeeze plays we've seen in other stocks, like GameStop (GME).
Down 30% on Thursday and the volatility remains quite heavy. Let's look at the charts.
Trading Rocket
Daily chart of Rocket stock
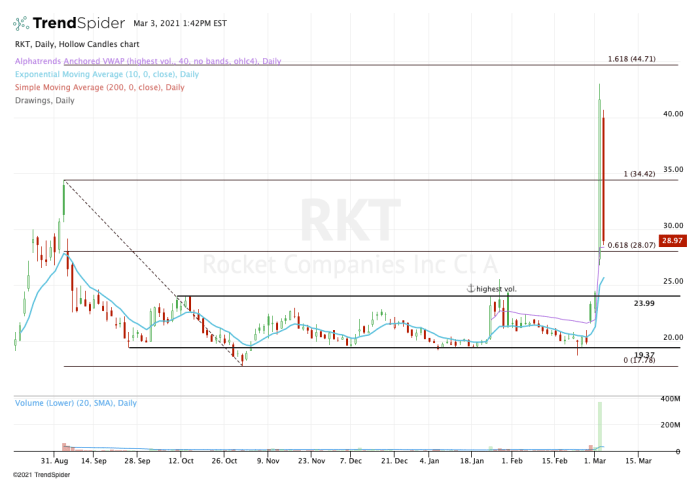
Chart courtesy of TrendSpider.com
Rocket has been stuck in a range for months, bouncing between $19 on the downside and $24 on the upside.
The $24 mark is the resistance point I referenced earlier in the article - the one that the stock faded from after reporting earnings.
After back-to-back tests of this mark, shares were prepping for a big move. I was hoping that perhaps Rocket stock could clear the 2021 high and test into the 61.8% retracement. Perhaps if bulls were lucky, the stock could fill the gap near $31.
How remarkably conservative that outlook was.
Shares gapped above the 61.8% retracement and didn't hesitate to take out the high at $34.42, before topping at $43.
I was hopeful that Wednesday's pullback would find support at $34.42. Early in the session it did and bulls got a decent bounce as a result, but the move couldn't stick.
Now well below that mark, let's see if it closes below it. There is a silver lining though, as shares hold the 61.8% retracement and VWAP support near $28.
If that remains the case, keep an eye on that $34.50 area. That will be the mark that either keeps a lid on Rocket stock or gives it the green light to retest its high at $43.
Above $43 and the 161.8% extension is in play at $44.71.
On the downside, look for a test of the 10-day moving average. Should shares fill the gap from this week's move, bulls need to see $24 resistance turn into support. Back below is a very bad look.
From TheStreet.com