Opinion: The smart money is record ‘short’ in stocks, and the dumb money is record ‘long’

And that begs the question: Is it time to get out?
By Simon Maierhofer, MarketWatch
In the post-2009 bull market in stocks, investors have been stubbornly bearish — to their own detriment.
The most recent, and most pronounced, bout of pessimism happened in January and February 2016, when we issued a “buy” signal.
Bull markets die of “starvation.” Just as a fire needs wood to burn, the stock market needs fresh buyers to climb higher. Relentless gains have converted many bears into buyers, providing the fuel for an insistent string of new all-time highs.
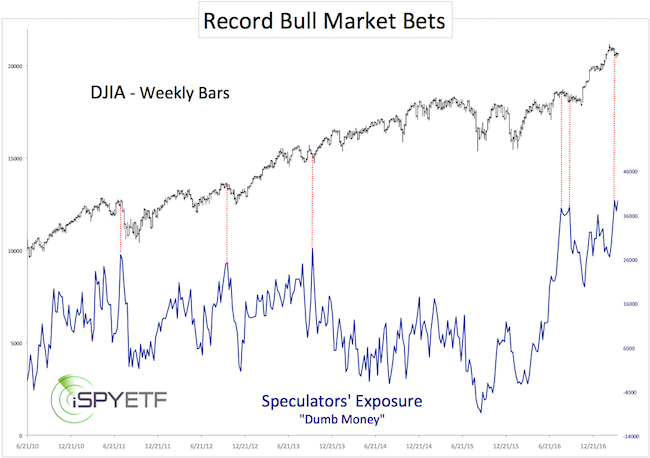
Speculators are “all in”
According to the CFTC’s commitment of traders (COT) report, speculators are finally all in and more bullish than ever. Speculators have a reputation to be trend followers (for better and, eventually, for worse).
Chart No. 1 plots the Dow Jones Industrial Average DJIA, +0.35% against speculators’ exposure, and illustrates that trend followers are lousy market timers (dashed red lines).
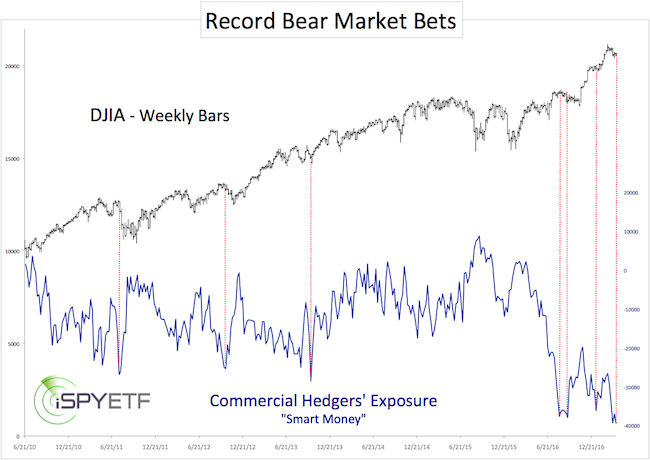
Smart money is “all out”
While trend followers are all in, commercial hedgers (“smart money”) are “all out.”
In fact, hedgers have racked up more short positions than at any other time in history (chart No. 2).
To sum up, smart money is record short, and dumb money is record long.
Just how bearish is this combustible constellation?
Bear market risk in context
There are literally dozens of investor-sentiment indicators, and experience has shown that looking at a broad-based sentiment picture is more beneficial than focusing on one or two historic extremes.
To provide context, chart No. 3 plots the S&P 500 Index SPX, +0.27% against six investor-sentiment gauges (CBOE SKEW; CBOE equity put/call ratio; CBOE VIX; active money managers poll, NAAIM; investment adviser poll, II; and retail investor poll, AAII).

The only indicator in “danger” territory is the CBOE equity put/call ratio. Some may argue that the VIX is suggesting a major market top, but historically the VIX is actually too low for a major stock-market top.
Overall optimism peaked in mid-February (red bar) and has gradually receded from “too bullish” to “neutral.”
Conclusion
Speculators are record long, and commercial hedgers are record short. That potentially dangerous constellation is partially disarmed by a much less bearish, larger-scope sentiment picture.
The S&P 500 stalled and corrected at peak optimism around 2,400, which has been the Profit Radar Report’s intermediate (but not final) upside target since January 2016.
Outlook
The year-to-date S&P 500 pattern points toward more gains ahead once this correction is complete.
Chart No. 4 provides a visual of every year where the S&P 500 started strong and reached new all-time highs (or at least a three-year high) within the first six weeks.
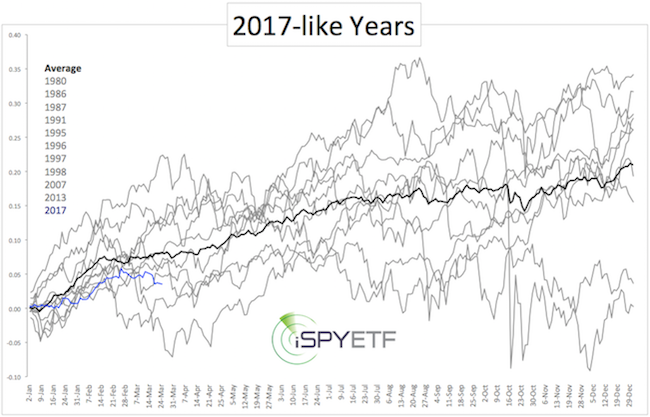
One year later, the S&P 500 was higher nine of 11 times (notable exceptions were 1987 and 2007, which may become applicable later in 2017), with an average gain of 16%.
In conclusion, based on investor sentiment, the S&P 500 may drop lower, but new lows should prove to be a buying opportunity for the next (and potentially final leg) higher.
How deep this correction could become is discussed on the short-term S&P 500 outlook, and why we may soon see the final up leg in the long-term S&P 500 forecast.
Courtesy of MarketWatch