Mid Cap Stocks Should be Stealing the Show After Q1 Earnings
Last week we took a look at the broad market's earnings for Q1, using the S&P 500 as out proxy. Though earnings season isn't actually over yet, with 84% of the S&P 500's constituents having reported last quarter's results, where the S&P 500's per share earnings are is where they're going to be. And as a reminder, where they were for the first quarter is at $29.43, up 22.7% on a year-over year basis. Don't get too excited just yet though. After taking out the energy sector's unusually high growth (due to the comparative bar being set very low), last quarter's earnings progress is just so-so.
As it turns out, however, that's not the case with all slivers of stocks. When you look past the large caps that make up the S&P 500 and think a little smaller and look at the mid caps -- the names that make up the S&P 400 -- there's more growth to be excited about.
As of the latest tally, the S&P 400 earned $18.26 last quarter, up 37% on a year-over-year basis. Once again the energy sector's turnaround was responsible for the bulk of that improvement. More so than the S&P 500's individual sectors though, the S&P 400's sectors are each showing a positive growth trend.
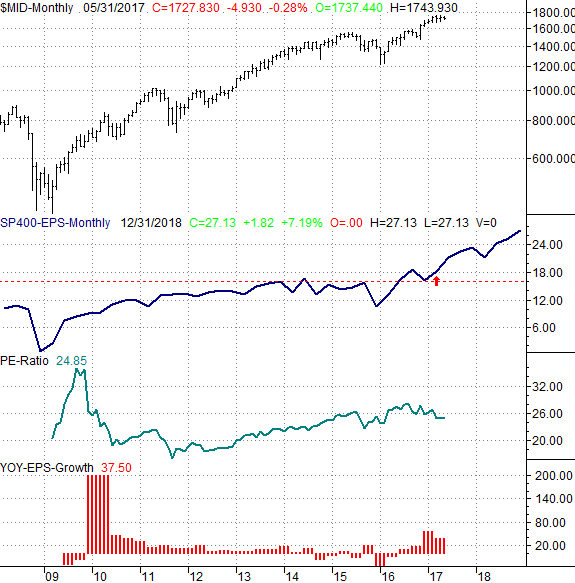
The individual sectors within the S&P 400 sliver of the market is another story though -- for us, right now, let's limit our look to just the index as a whole. As is usually the case, a graphical presentation is more telling than one set of raw numbers is.
As the chart of the S&P 400 Index and its earnings trend/projection indicates, these companies are collectively over the hump that most large cap names aren't. And, though still rich at a trailing P/E of 24.85, that's actually not too far away from the normal P/E ratio for these higher-growth stocks. The forward-looking P/E is a quite-compelling 19.5.
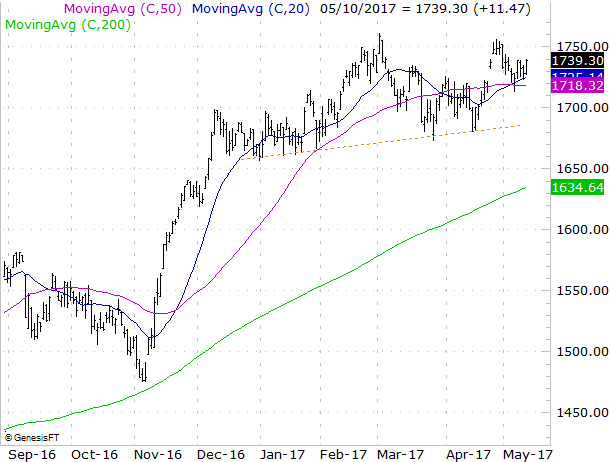
Like most other stocks, the S&P 400 Mid-Cap Index has made steady, albeit erratic, uptrend. Though arguably overbought, the higher lows and (mostly) higher highs set the stage for another bullish thrust in the foreseeable future. Let's just hope investors don't look at the calendar and remember this is a lethargic time of year.
That being said, it's worth noting that not all mid caps are doing as well as the broad index is. The Mid-Cap Value index is lagging -- along with other value stocks -- while the Mid-Cap Growth Index is into record-high territory.

Take a closer look at the performance-comparison chart, however. While mid-cap growth stocks have some momentum, the shape of the mid-cap value index suggests it's in a turnaround mode.
You can see it better with a traditional bar chart of the S&P 400 Mid-Cap Value Index. Whereas its growth counterpart is well into new-high territory, the mid-cap value stocks are just now collectively crossing above the 20-day and 50-day moving average lines. They've got a lot more room to climb before bumping into a major headwind.

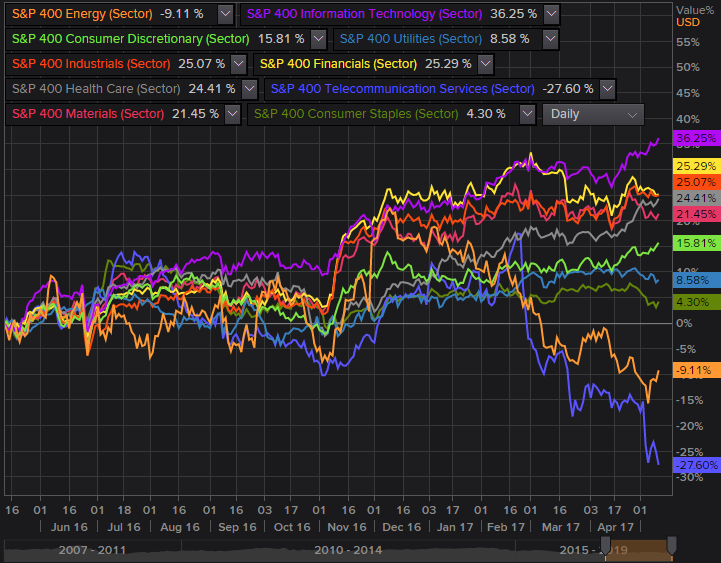
And for what it's worth, it's the mid-cap tech stocks and the mid-cap discretionary stocks that are doing most of the driving for the S&P 400's growth names. You have to like the momentum, but tech as a group looks poised for some profit-taking. Healthcare and industrials from the S&P 400 also look... well, healthy.
Telecom is lagging, as are energy stocks, though mid-cap telecom names look so beaten-down they're tempting. Another time though.
The bottom line is, as a group, the mid caps look preferable to large caps here after Q1 earnings, and even within the mid cap group some arenas look better than others.