Macy's Stock: Here's What's Next After Earnings Surge
-- Macy's stock is hitting three-year highs after better-than-expected earnings. Here's what the charts look like now. --
By Bret Kenwell, TheStreet.com
Investors in Macy's (M) are celebrating on Thursday. The shares are hitting multiyear highs after the Cincinnati retailing icon delivered better-than-expected earnings.
The retailer has been struggling for years as consumers' shift to e-commerce has made life tough for department-store operators.
That's as Macy's and its peers have been doing their best to keep pace with Amazon AMZN) - and others.
The company was finally rewarded for its efforts, with the stock up more than 20% on Thursday. Along with Nvidia (NVDA) it's one of the top gainers on the day. The rally in Macy's comes as the company beat analysts' expectations and upped its guidance. Now the bulls are wondering just how high this stock can go. Let's look.
Trading Macy's Stock
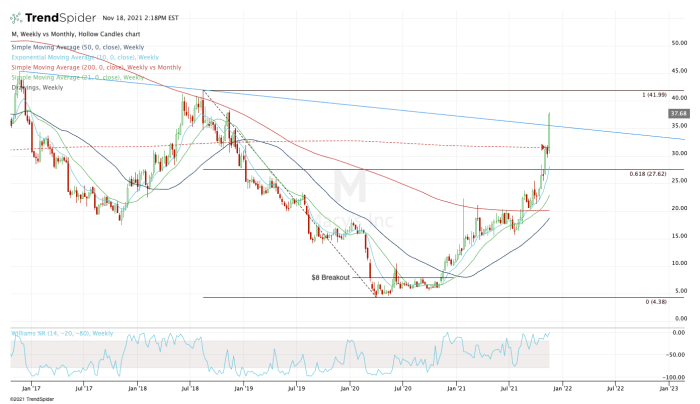
Daily chart of Macy's stock
Chart courtesy of TrendSpider.com
When we look at Macy's, the action is just incredibly impressive. After years of underperformance, not many investors were expecting such a run.
That run didn't start with today's earnings reaction, though. Instead, the move started about a year ago, when Macy's stock broke out over $8.
That ignited a powerful rally into 2021, in which Macy's has closed higher in each month except July. In fact, the stock has climbed in 13 of the past 14 months. Bottom-fishers in this stock have been rewarded handsomely for their patience.
Before this week, the stock was struggling with its declining 200-month moving average. But it was holding up over its 10-week moving average and the 61.8% retracement of a multiyear range.
With today's push, Macy's stock is clearing both the 200-month moving average and downtrend resistance (blue line).
If the stock can hold up over the $34 to $35 area, it could put the $42 level on the table.
There it finds the 2018 high, a level it hasn't seen in quite some time.
If Macy's stock can't hold the $34 to $35 area, it may pull back to the 200-week moving average. The hope is that this area will be support, particularly if the 10-week moving average comes into play nearby.
With the move (and the rally over the past few months), this stock is a buy-the-dip candidate until the trend shifts.
From TheStreet.com