Here’s why one chart watcher says the stock market is finally ready for a pullback

- Mind the ‘gap’ on the S&P 500 daily chart: BTIG’s Stockton -
By Anora M. Gaudiano, MarketWatch
There‘s no single technical indicator that reliably calls tops and bottoms. But when certain conditions begin to agree, it can offer a valid signal, according to analysts.
A confluence of technical considerations have formed a “perfect condition” for a mild pullback for stocks, according to Katie Stockton, chief technical strategist at BTIG. And such a pullback would help set the stage for a longer term run in record territory, she said.
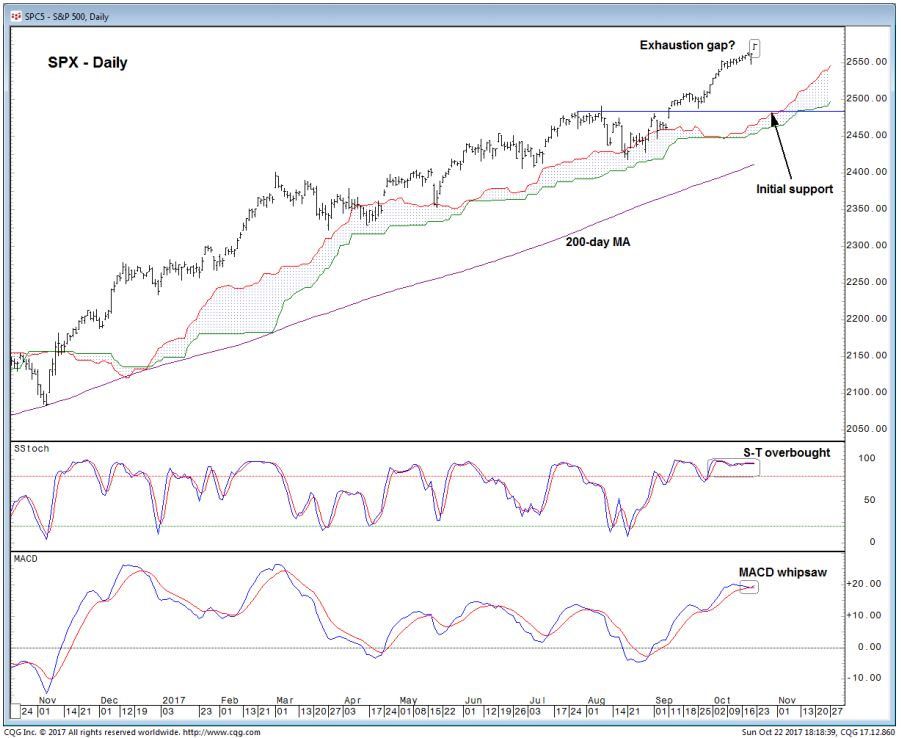
The S&P 500 Index is traded 4 points, or 0.2%, lower to 2,570, after six straight weeks of gains, which culminated with a “gap” higher open on Friday. A gap occurs on a daily price chart when an asset opens above the previous session’s high.
It’s this gap, alongside technical indicators that are flashing significantly overbought conditions, that caught Stockton’s attention.
“Prolonged overbought conditions on their own do not indicate anything other than being overbought, and markets can stay overbought for some time,” said Stockton.
“But when such a gap appears after prolonged overbought conditions, it is exhaustive in nature and suggests that the short-term momentum is likely to waiver,” Stockton said.
“Overly bullish sentiment, as seen by CNN’s Fear and Greed indicator also tends to lead to pullbacks. That indicator peaked in early October,” she said.
CNN’s Fear and Greed Index stands at 91 on a scale of 0 to 100, with the 100 being extreme greed and zero being extreme fear. On Oct. 5 it hit 94.
“If we close lower sometime this week, then, the downside risk will increase,” Stockton said.
The S&P 500 is trading well above its long-term trend lines, such as 100-day and 200-day moving averages. Those levels are often seen as a support level when markets are falling and resistance levels when markets are rising. Breaking past those trend lines normally indicates a larger pullback.
But the initial support level is at approximately 2,448, according to Stockton —that’s when the S&P 500 hit a record and stumbled during August. Stockton expects the market to fall more than 3%. She said a pullback of that magnitude —which has not happened in nearly a year —would be healthy.
“We think a mild pullback would relieve the market of overly bullish sentiment and refresh the uptrend in time for a year-end rally. Our target for the fourth quarter remains at 2,640,” Stockton said.
So, what about a larger pullback?
“The long-term positive momentum is there and not only in U.S. stocks, but in Japanese and emerging-market stocks. Which is why we think any pullback is an opportunity to add exposure to U.S. stocks,” Stockton said.
The only caveat? Technical analysis of stock market prices changes with prices themselves.
“If something changes, then we will change our view,” Stockton said.
From MarketWatch