Hasbro Stock: How High Can It Run? Two Chart Levels Stand Out.
-- Hasbro stock is rallying on earnings and these two levels stick out on the upside --
By Bret Kenwell, TheStreet.com
Hasbro (HAS) stock is rallying on a mixed quarterly report, up about 5% so far on Tuesday.
Will the earnings report be enough to keep Hasbro stock pushing higher?
The company actually missed on earnings expectations, with profits dropping notably year over year, down 43%.
However, revenue beat analysts' estimates and the company's outlook has the stock reacting favorably on the day.
Earlier this year, Alta Fox Capital Management took an activist role in the stock as it acquired a 2.5% stake in Hasbro stock.
Alta Fox has previously compared Hasbro's full-year outlook to Mattel's (MAT) and argued that Hasbro stock could ultimately move to $200 under the right strategy.
Today's action is a step in the right direction, but there are questions as to whether the rally can be sustained.
Trading Hasbro Stock
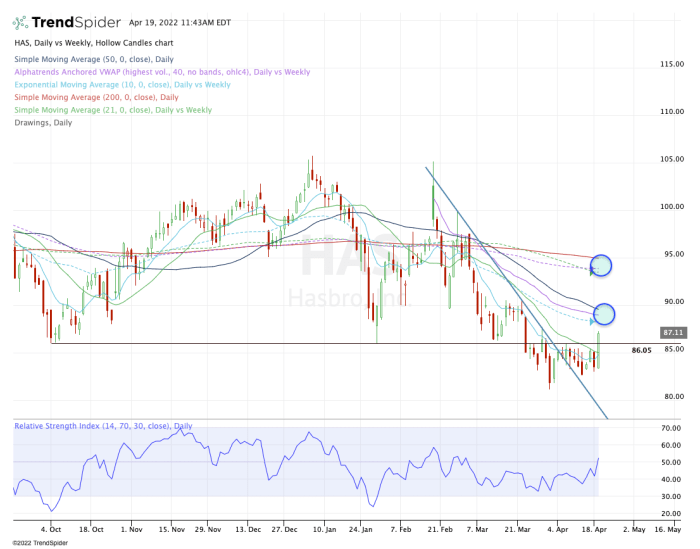
Daily chart of Hasbro stock
Chart courtesy of TrendSpider.com
Unlike the majority of the market, Hasbro recently broke to new lows earlier this month.
However, the stock was recently able to push above downtrend resistance (blue line), even as it continued to struggle with the 10-day and 21-day moving averages.
With today's post-earnings rally, Hasbro stock not only cleared these two key short-term moving averages, but it also reclaimed $86.
The $86 level was the fourth-quarter low, as well as the low in January and February. In late March, it broke below this mark and it served as resistance until today's rally.
So now what?
From here, bulls desperately want to see Hasbro stock stay above $86, as well as the 10-day and 21-day moving averages.
If it can do that, there are two upside areas that stick out to me: $88.50 to $89.50 and $93.50 to $95.
The first area of interest is not too far off and includes the 10-week and 50-day moving averages, as well as the daily VWAP measure.
The next area calls the 21-week and 200-day moving averages into play, along with the weekly VWAP measure.
Above all of these levels will open the door for a potential push to $100.
On the downside, a move below $86 and the 10-day and 21-day moving averages puts this year's low of $81.16 back in play.
From TheStreet.com