Buy or Sell AMD Stock? The Chart Provides a Clue.
-- AMD stock has rebounded nicely from the lows but has trailed other leaders, like Nvidia. Here's how it can catch up. --
By Bret Kenwell, TheStreet.com
Growth and technology investors are anxiously awaiting the return of stocks like Advanced Micro Devices (AMD), Nvidia (NVDA) and others.
As for Nvidia, we took a look at the stock earlier this week as it was testing its 200-day moving average for the first time since April.
Both Nvidia and AMD are looking much better, but they're not out of the woods just yet.
The price action in Advanced Micro Devices has been very interesting this year. For a while, it was holding up better than Nvidia was. That's as it wasn't reporting disappointing earnings and/or issuing disappointing preannouncements.
Then, like Nvidia, it started to do just that and the stock has been under pressure since.
Nvidia has suffered a peak-to-trough decline of 68.8%, while AMD has suffered a similar stumble, 66.8%.
The recent rally has been less similar, though.
Nvidia stock has rallied more than 73% from the October low, while AMD has rallied 45%.
Can AMD Stock Play Catchup to Nvidia?
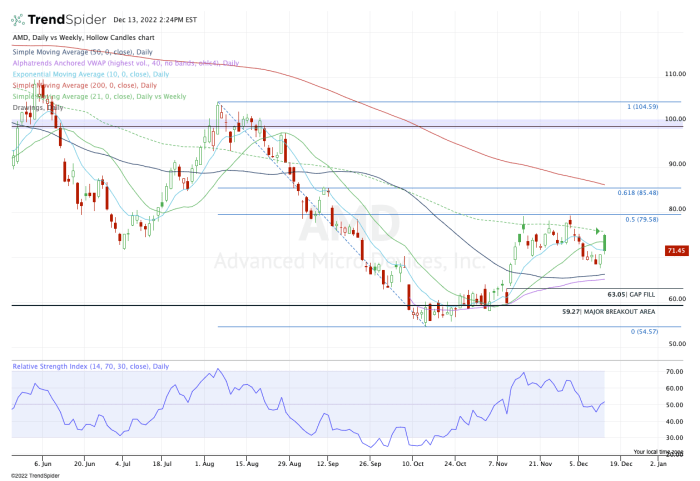
Daily chart of AMD stock
Chart courtesy of TrendSpider.com
Shares of AMD have been eroding over the past few sessions but traded well on Monday ahead of Tuesday's inflation report.
With the market's big gap-up action this morning, AMD stock also went for the upside ride. But it's struggling to maintain today's rally. At one point, the shares were up 6.4% and just a few hours later they were flat. At last check they were 1.4% higher.
The $70 to $71 level has been meaningful over the past week, but it's hardly pivotal.
If AMD can stay above it, that's constructive. But it really needs to clear today's high of $75.21, thrusting it above the 10-day and 21-day moving averages and putting clear resistance at $79 in play.
Above $79 and the door opens up toward $85. Near $85, we find the 61.8% retracement and the 200-day moving average.
On the downside, a break of $70 opens the door to this week's low near $67.50, then puts the 50-day moving average and daily VWAP measure in play.
Ultimately, it wouldn't be the worst thing in the world to see the gap get filled near $63, but let's go one step at a time.
From TheStreet.com