Are American Air, Delta Air and United Air Shares a Buy? Check the Charts.

-- Airline stocks are on the mend, but are they about to experience more turbulence? Here's the trade. --
By Bret Kenwell, TheStreet.com
When Covid-19 hit, the airline industry was one of the most disoriented and hardest-hit groups.
While the pandemic wreaked havoc on consumers, and in supply chains in every sector, revenue in the travel industry more broadly evaporated seemingly overnight.
Fast forward to January 2022 and Delta Air Lines (DAL) United Airlines (UAL) American Airlines (AAL) other airline stocks were bucking the selloff trend.
But the stocks eventually came under pressure as the entire U.S. stock market continued to decline and as geopolitical turmoil in Eastern Europe continue to heat up.
Rising oil prices aren't helping matters, driving up costs at a time where revenue hasn't fully recovered to prepandemic levels.
On the plus side, this group is rising again as travel trends continue to improve and offset that rise in costs.
The recent plunge in crude may be giving these names an extra boost, too.
Trading Delta Air Lines Stock
Weekly chart of Delta stock.
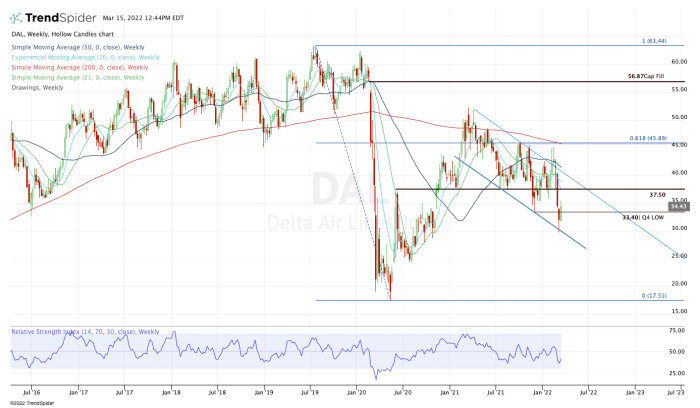
Chart courtesy of TrendSpider.com
On the weekly chart, you'll notice that Delta Air stock remains trapped in a downward channel, with $45 acting as resistance while $37.50 failed as support.
The stock recently broke below the fourth-quarter low of $33.40 but bounced off $30 and channel support. With the rebound, Delta stock has reclaimed the Q4 low.
From here, I'd love to see a continued move back toward $37.50 and the 10-week moving average.
For now with Delta - and like most stocks - I am keeping these former support levels and declining moving averages noted as resistance unless they are reclaimed. Above these marks will put channel resistance back in play.
Trading United Airlines Stock
Weekly chart of United Airlines stock.
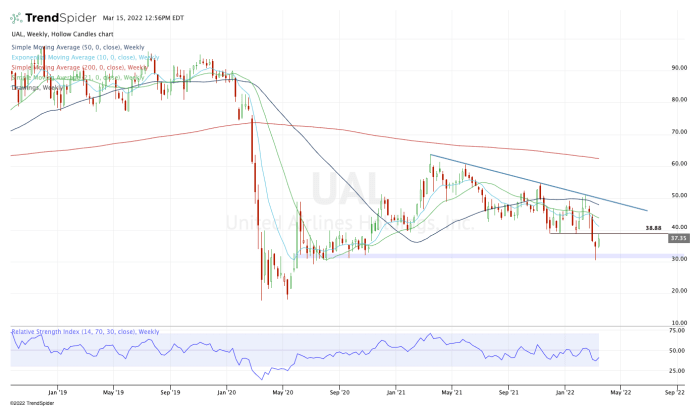
Chart courtesy of TrendSpider.com
Like Delta, United Airlines stock slumped last week, falling hard over a three-week span in which it dropped almost 36% from the high to the low.
Downtrend resistance continues to squeeze the stock lower, while the 50-week moving average is now acting as resistance, too.
Also like Delta, United Airlines stock is bouncing from the $30 area, which was a major support zone in the second half of 2020. That said, the stock is struggling to reclaim the $38.75 area.
If it can do so, it puts the 10-week and 21-week moving averages in play.
But the real measure to watch is the 50-week - assuming United Airlines stock can rally that far.
On the downside, a break of $34.25 puts the $30 zone back in play.
Trading American Airlines Stock
Weekly chart of American Airlines stock.
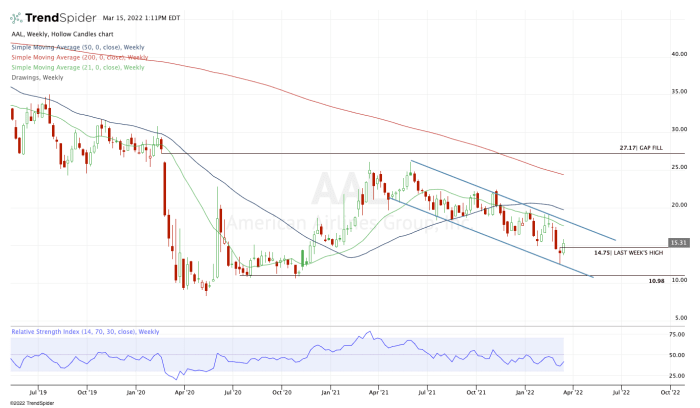
Chart courtesy of TrendSpider.com
American Airlines stock has a really interesting chart as we get a weekly-up rotation. The others are also enjoying this rotation over the prior week's high, but in the case of American, the shares appear able to make a quick move up to the $17.50 to $18.25 area.
In that zone, bulls find active resistance via the 21-week moving average, as well as channel resistance. Above this area opens the door to $20 and the 50-week.
With the shares pushing higher today, let's keep an eye on last week's high of $14.75. If this level breaks, it puts this week's low back on the table near $13.70.
While it's a bit far away at the moment, I'm keeping an eye on the $11 area if American Airlines stock really starts to break down.
From TheStreet.com