Amazon Stock Split: What the Charts Say Ahead of 20-for-1 Split

-- Amazon stock is working on its sixth straight daily rally ahead of its 20-for-1 stock split. Here's what the charts say now. --
By Bret Kenwell, TheStreet.com
Shares of Amazon (AMZN) have spent most of the year down in the dumps, as it suffered a peak-to-trough decline of 46%.
That, however, has not been the case lately. The stock is up about 2.5% on Thursday and is currently riding a six-session win streak. Amid that stretch, Amazon stock has rallied 20%.
The move comes ahead of the company's 20-for-1 stock split, which will go into effect on Monday, June 6.
Some have wondered if Amazon is "past its prime" as the stock split nears. Given the way the retail and tech giant's shares have performed over the past two years, that's a fair question to ask.
For what it's worth, the stock is roughly flat in that span. Despite a robust post-dovid recovery and boom in its business, supply chain woes and concerns for growth have crippled the share price.
Now with a new catalyst in play and a renewed bid in tech stocks - for now - let's look at Amazon stock ahead of the stock split.
Trading Amazon Stock
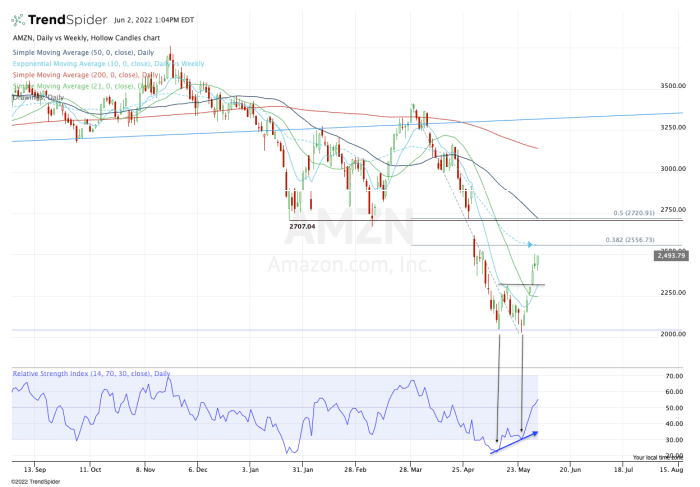
Daily chart of Amazon stock

Chart courtesy of TrendSpider.com
In late May, Amazon stock faltered after a rally to the 10-day moving average was met with resistance. Upon retesting the low from earlier that month, though, the stock found its footing and closed strong on the day.
It did so with bullish divergence on the daily chart as well (illustrated with a blue arrow in the RSI field). This was a classic reversal, as the shares have been powering higher since undercutting the prior low.
After the stock blasted through the 10-day and 21-day moving averages. though, the bulls found themselves in a tough spot with the stock. Just how much further upside could it have?
If Amazon stock continues to rally through the stock split, keep an eye on the $2,550 area. There we find the 38.2% retracement, as well as the declining 10-week moving average.
If the stock is able to push through this area in the days and weeks ahead, it opens the door to the $2,700 to $2,725 area. There it will find the 50% retracement, as well as the 50-day moving average.
On the downside, I want to see the high from May 17 hold as support at $2,316. That's also roughly where the rising 10-day moving average comes into play.
Below that and the $2,250 zone is on the table, near the 50% retracement of the current rally and the 21-day moving average.
Put in a nutshell? Stocks like Amazon tend to rally into events like a stock split. Given how far it fell, though, perhaps there could be some continued upside after the split. In either case, we have the support and resistance levels laid out above.
From TheStreet.com
