Zeroing In On All-Time Highs - Weekly Market Outlook
Zeroing In On All-Time Highs - Weekly Market Outlook
Despite Tuesday's and Friday's setbacks, the market managed to post a respectable gain last week...the third winning week in a row, and the tenth winning week in the last eleven. When it was all said and done, the S&P 500 (SPX) (SPY) gained 0.6% last week.
The S&P 500 did NOT reach that all-time high of 1576.09, though, even though the Dow Industrials (INDU) (DIA) managed to walk a little further into uncharted territory. In fact, the S&P 500 only reached a high of 1563.62 last week. That's suspiciously close to the record without actually getting over the hump, leaving one to wonder if traders are mentally preparing to start selling once that prior peak is eclipsed.
We'll look at that potential triple-top in a second, right after poking and prodding last week's and this week's major economic numbers.
Economic Calendar
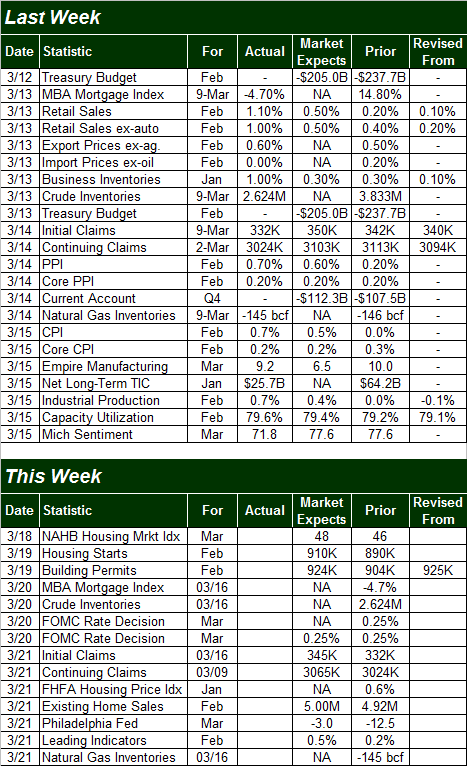
A real busy week last week... we'll stick to the highlights.
The good news parade started on Wednesday with last month's retail sales. They were, surprisingly good. Retail spending was up 1.10% overall in February, and up 1.0% not counting cars. That's from January's numbers too, mind you. On a year-over-year basis, they were even better.
The flipside: Prices are going up for producers too, crimping the margins that would have otherwise widened. Producer (input) prices were up 0.7% overall, though only up 0.2% on a core (ex-food and energy) basis. The annualized inflation rate is now a palatable 1.7%.
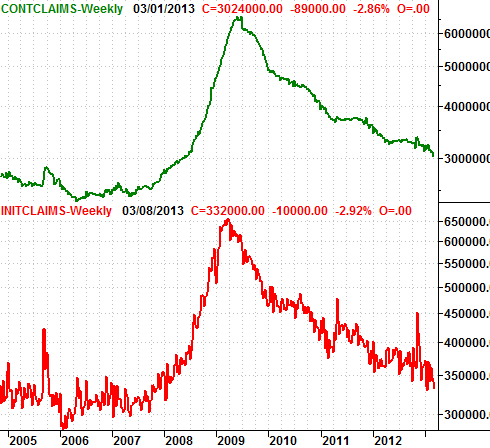
Thursday was also the day unemployment claims moved to new multi-years lows.... again. The Department of Labor said there were only 332,000 new claims in the prior week, and only 3.024 million ongoing unemployment claims. It's superficially good news, though may overstate the true health of the current labor market.
New Unemployment Claims, & Continuing Unemployment Claims
 On Friday we heard the other side of the inflation picture - the change in the consumer price index for February. Consumer prices rose 0.7% last month, but only 0.2% on a core basis. The annualized inflation rate is now 1.98%.
Last week's biggest data, however, was Friday's unveiling of February's industrial production and capacity utilization. Both were above January's levels - the key to a bullish interpretation - extending the growth streak to four months. We've mentioned it before, but it bears repeating now that the direction these two data sets point correlate very highly with the broad market's direction. As long as they're pointed higher, we're in a bull market.
Economic Calendar
 This week is going to be much lighter, but it's going to be a huge week for the housing market.
Housing starts and building permits kick things off on Tuesday. The pros are saying the latter will roll in at an annual pace of 924,000, and the former will read an annualized score of 910,000. Both are improvements on January's levels, but more than that, a higher reading would bring the broad growth trend in both numbers to well over the two-year mark.
That's the last major data point we'll hear about the housing market until Thursday's FHFA Housing Price Index and the NAR's existing home sales figure. The National Association of Realtors expects their home sales number to reach a pace of 5.0 million, up a little from January's level.
The only other thing worth keeping tabs on this week is Wednesday's Federal Reserve meeting, which is where changes in interest rates (among other things) get discussed. We're not looking for a rate change this time around, but as always, the Fed's thoughts and language will be telling.
Stock Market
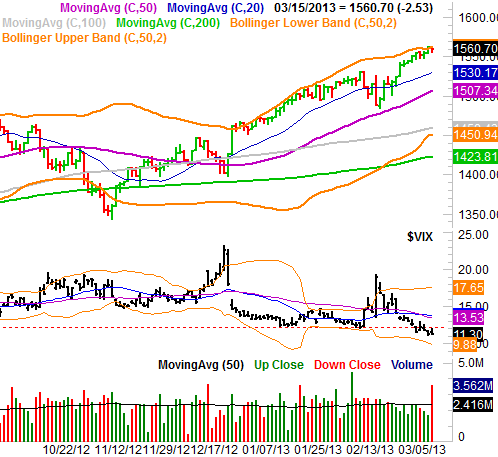
Last week's close at 1560.70 for the S&P 500 was the best close since October of 2007. But, it was still shy of the all-time high of 1576.09 reached then. More specifically, the S&P 500 is suspiciously slowing down as it approaches that peak level (which is also in line with the peak level from April of 2000). Could the market just be waiting and looking for a reason to form a triple top? Don't dismiss the idea.
With or without the makings of a triple top though, there were a few bearish red flags that started to wave with Friday's admittedly-modest pullback . One of them is the sheer amount of volume that started to flow out of stocks that day. It was the highest volume day of the year, and though it wasn't a monster-sized selloff, a ton of people were using the peak as a chance to quietly wade ou t. It's a hint that the undertow may be starting to turn bearish in a serious way.
Heavy volume wasn't the only reason stocks could be in bigger trouble here than most people realize. Take a look.
S&P 500 & VIX - Daily
 That orange line that capped the rally effort last week is the upper 50-day Bollinger band. It's not the first time it's halted the bullish effort either; it did the same in January, and if you go further back into late lat year, you'll see the upper 50-day Bollinger band has been a ceiling plenty of times of late.
To be clear, hitting a wall at the upper 50-day Bollinger band isn't inherently a recipe for a pullback; this may just halt the advance for a while, and result in nothing more than sideways movement. Then again, with the S&P 500 up 15.3% since the November bottom, there's a lot more pent-up profit-taking potential now than there's been in a while.
The CBOE Volatility Index (VIX) (VXX) only compounds the confusion here . Its downtrend is bullish for stocks, but the fact that the VIX is now at multi-years lows (and under its prior floor at 12.2) is actually a little scary. More often than not, when we start to get comfortable with the VIX being this low, the market finds a way to punish that complacency.
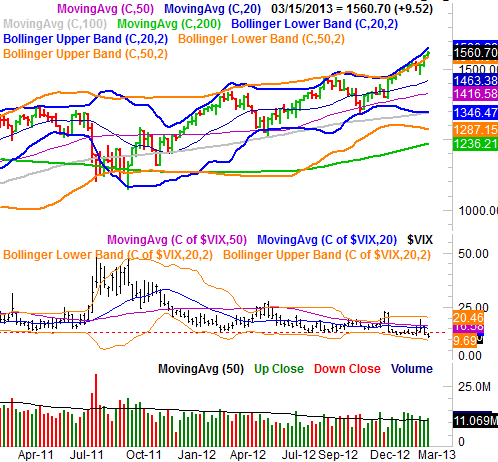
Just for a little more perspective, take a look at the weekly chart of the S&P 500. You can see just how overextended the market is here. Given its recent history, this is roughly where the index should be topping out. It would be a fitting to see it happen also where the market has made its last two major tops; the April-2000 peak was 1552.87.
S&P 500 - Weekly
 Trade Well,
Price Headley
BigTrends.com
1-800-244-8736

