What Now After Friday's Selloff - Weekly Market Outlook
What Now After Friday's Selloff - Weekly Market Outlook
The market may have closed out last week with a gain (the third in a row, by the way), but it certainly didn't finish the week on a high note. In fact, it ended the week waving a bearish red flag. The irony? The Federal Reserve gave investors exactly what wanted to hear on Wednesday... strong clues that its QE efforts weren't about to end any time soon. The knee-jerk bullishness only lasted through the end of that day, though, and the gain was completely unwound by Friday's close.
What's it mean? It could mean a lot of things, one of them being that traders were headed into Wednesday already willing to put together a "buy the rumor, sell the news" reaction; we just happened to get a bullish bump after Bernanke's comments because he threw us a bullish curveball. Or, it could mean that once investors had time to think about it, they realized the need for a stimulus means the economy is tepid... which is a problem. Or, maybe the stumble on Thursday and Friday took shape simply because the market was so overbought as of Wednesday . There's another possibility too - a combination of all those explanations.
Whatever the reason, we're still going to have to deal with the market's budding pullback to start this week, and decide whether or not Friday was just a blip, or a full-blown omen. We'll weigh those odds in a second. First we want to slice and dice last week's economic numbers.
Economic Calendar
We got a decent-sized handful of economic data last week, but there were only a couple of sets we're really concerned about.
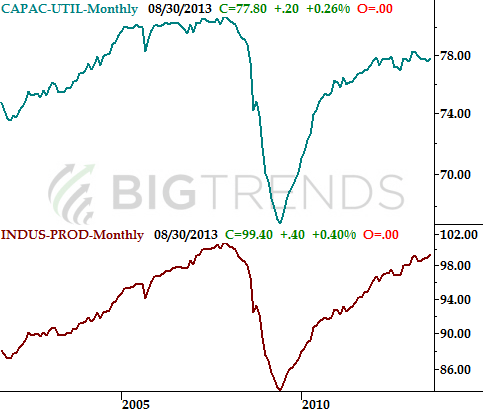
The first set of data worth a closer look is the Federal Reserve's industrial production and capacity utilization. Both improved a little last month, after several months of non-movement in either direction. It's still a little premature to say both are firmly pointed in a positive direction again, but all big trends start as small ones.
Capacity Utilization and Industrial Productivity Index
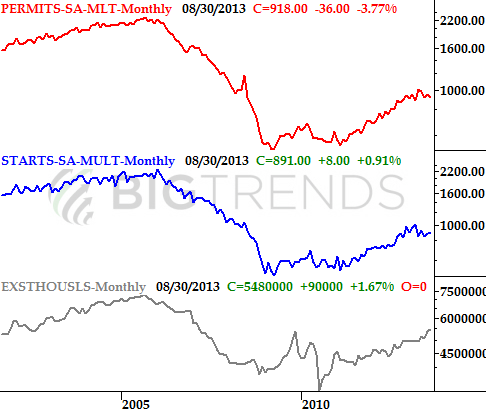
We also got a big dose of housing market data, with August's housing starts and building permits being posted on Wednesday, and existing home sales on Thursday. Starts were up a little, and permits were down a tad more... a split decision, at least on the construction front. But, existing home sales caught some people off guard when it jumped to a multi-year high pace 5.48 million. What could have caused the jump in demand for already-built that didn't show up in the newly-constructed segment? Great question. It should be interesting to see how that plays out.
Housing Starts, Building Permits, Existing Home Sales
The rest of the real estate picture will be rounded out this week when we get a couple different home price index updates on Tuesday, and new home sales data on Wednesday.
Economic Calendar
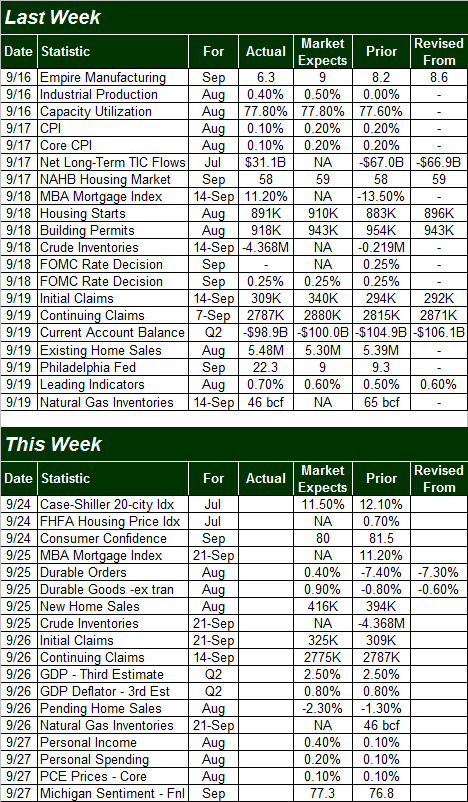
As for what to expect this week, as was already noted, we're hearing the Case-Shiller Index as well as the FHFA Housing Price Index levels on Tuesday. Both were up firmly in July, and the pros expect another good month here.
On Wednesday we'll hear last month's durable goods data. Economists are looking for a 0.4% improvement overall, and a 0.9% uptick with transportation orders taken out of the picture. Of course, after July's disastrous 7.4% dip (-0.8% ex-transportation), that's not exactly a big step forward.
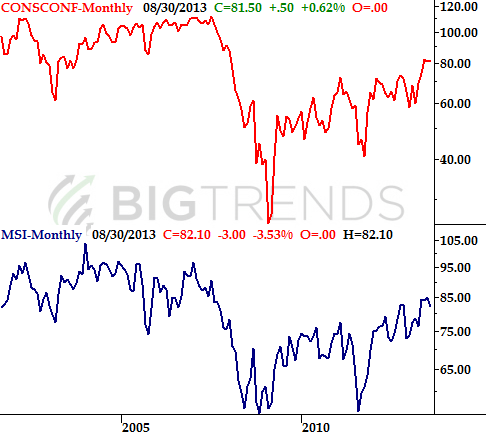
It's also a big week on the sentiment front, with the Conference Board's consumer confidence score coming on Tuesday, and the final Michigan Sentiment Index reading due on Friday. The forecasts are on the pessimistic side, though the bigger trends are still bullish for both.
Consumer Confidence, Michigan Sentiment Index
Stock Market Index Analysis
Let's start with weekly chart of the S&P 500 (SPX) (SPY) this week, just to paint the bigger picture first. It won't be tough to see why there's good reason to be pessimistic here.
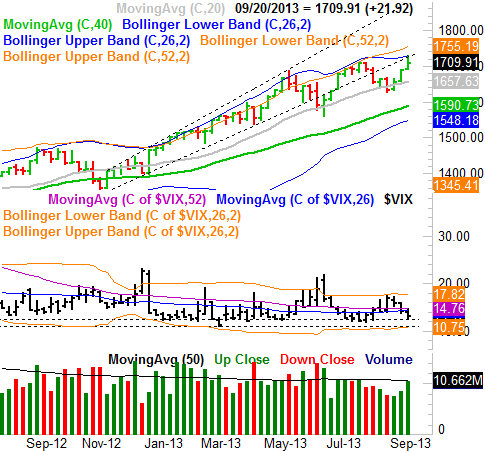
Yes, last week the S&P 500 gained 21.92 points (+1.3%) last week to close at 1709.91. It was a struggle to make and retain that progress, however, and may have already started a pullback.
The weekly chart sure says last week's highs would have been the textbook rollover points. The S&P 500 bumped into its upper 26-week Bollinger band last week, and immediately turned tail. You can also see that peak at 1729.86 last week was right in line with what used to be a major support line. That support failed in June and again in August. Though no longer a technical floor, lines that used to be floors can and do easily become ceilings, or resistance. It looks like that may be what's happening here.
S&P 500 & VIX - Weekly Chart
Point being, this is an ideal time and situation for a pullback to materialize.
When you zoom into a daily chart of the S&P 500, things get downright alarming. Friday's pullback was a 0.72% selloff. We've had bigger, but not recently, and when we have had bigger one-day selloffs after significant runups like the one we've seen take shape since late August [the S&P 500 rallied 5.8% between August 27th and last Wednesday], it's usually been at the beginning of more significant corrections. Not bull-market-killers, mind you, but nothing to brush off as just a little volatility either.
The CBOE Volatility Index (VIX) (VXX) didn't move much higher on Friday despite the selloff, ending around 13.12 -- within the 12/12.5 to 14 bottom range that's been seen many times over the past year.
S&P 500 & VIX - Daily Chart

You can also see that all it took was a brush of the S&P 500's now-converged 20-day and 50-day Bollinger bands to kick-start a pullback, just as we could have expected. The volume behind the pullback on Thursday and Friday was noticeably stronger than average too.
It's still too soon to say a bigger correction is a foregone conclusion. The market has been nothing more than a barometer of almost-daily shifts in the media's rhetoric of late, and that rhetoric could turn bullish again as early as Monday. That doesn't mean we shouldn't take chart's current clues at face value, but we should be aware that anything's possible in the current environment, and will be until we actually get to a point where there's real economic clarity.
Our plan here is to wait to see if the bulls can sidestep a pullback. Don't get too excited about a bullish day on Monday - we're due for a small dead-cat bounce sometime early this week. It would take at least a couple of days to get the rally back on track. Conversely, if we get a close under 1709 (August's peak and Friday's low), that should push the market past the point of no return and carry the S&P 500 all the way back to at least the 1675-ish area.
Trade Well,
Price Headley
BigTrends.com
1-800-244-8736