Watch The VIX & VXN For Clues - Weekly Market Outlook
Watch The VIX & VXN For Clues - Weekly Market Outlook
Stocks may have managed to squeeze out a gain last week, at least partially undoing its prior week's loss. But it was a challenged rally effort, and it's still too soon to say the market is back in a bullish mood/mode. Indeed, we're still technically in a downtrend, having posted three weekly losses in the last five weeks.
The good news is, there's quite a bit of clarity as to what will constitute the beginning of a new - and real - rally effort.
We'll show you those lines in the sand in a second. First we need to dissect last week's and this week's major economic numbers. Of course, unemployment was the focal point of last week's data.
Economic Calendar
As was noted, Friday's employment snapshot was the biggie last week, but it wasn't the only economic information worth keeping in mind. One of the other key data nuggets is the fact that Factory Orders slumped 2.4% in July. Not good. On the flipside, both ISM Indices (the regular "supply" one as well as the services index) grew. That's encouraging, though putting it all together creates something of a mixed message.
The employment data was no less mixed, however.
The Department of Labor reported payroll growth 169,000 jobs, which certainly isn't red hot, but was enough to pull the unemployment rate down from 7.4% to 7.3% for August. But, things weren't necessarily as positive as they seem on the unemployment front. While the technical unemployment rate went down, the size of the workforce (employed people plus people actually looking for work) actually fell about 300,000 last month, while the number of employed people as of the end of August was 115,000 fewer than we saw at the end of July. Point being, the employment "progress" wasn't nearly as solid as it seems on the surface.
Employment Snapshot, as of August
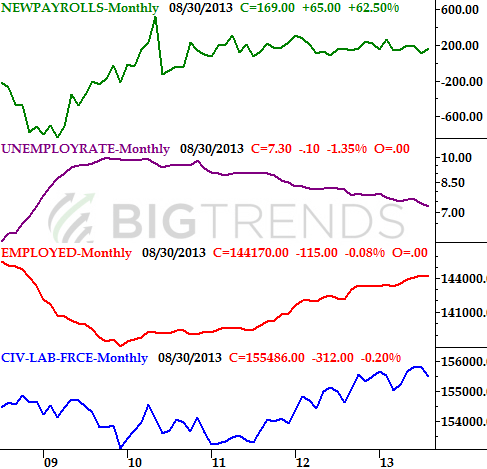 When it was all said and done, employment was pretty much a wash for August. Just something to bear in mind, particularly if you're handicapping the Federal Reserve's tapering date.
Everything else is on the grid below.
Economic Calendar
When it was all said and done, employment was pretty much a wash for August. Just something to bear in mind, particularly if you're handicapping the Federal Reserve's tapering date.
Everything else is on the grid below.
Economic Calendar
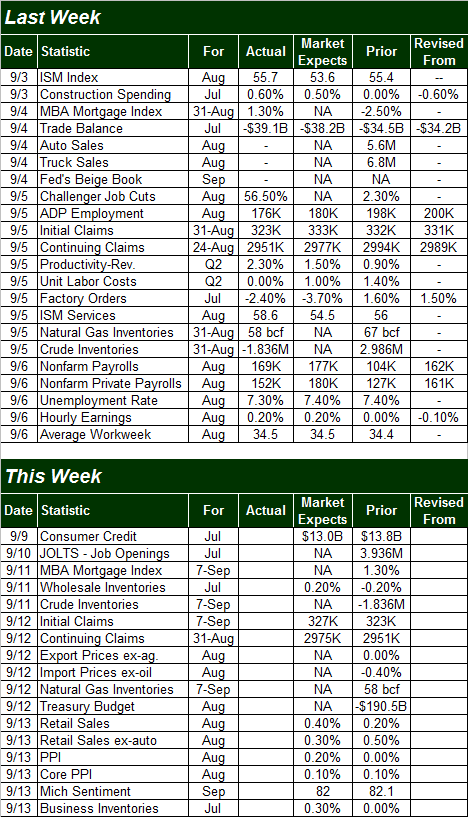 This week is going to be fairly busy in terms of data, and much of it is important enough to move the market.
The fireworks start on Tuesday with the newly-featured JOLTS (job openings) data. It's for July, however, so don't worry too much about it. Besides, there's no forecast yet... just be aware that it's coming and other people are going to be watching it.
The really hard-hitting numbers won't come until Thursday and Friday though.
We'll hear August's retail sales on Thursday. Economists expect a 0.4% increase overall, and a 0.3% improvement when taking automobiles out of the equation. That's decent. But, given how fragile things are at this point (economically speaking), there's no room for disappointment here.
On Friday we'll start painting the latest inflation picture, beginning with August's producer price inflation rate. The current annualized PPI rate is a palatable 2.1%, and the pros aren't looking for a big change with this week's update. It should be something of an omen for the consumer inflation rate, due next week. The CPI rate was 1.96% as of the end of July, which isn't "too high". But, it's rising rapidly, well up from April's annualized reading of 1.6%.
Stock Market Index Analysis
Like last week, we're going to have to look as a couple of different indices this week, as certain aspects of all them best explain particular situations we're in. Only by combining all of those ideas can we get a full grip on the market here.
If you're looking for a way to see the glass as half full (that is, if you're looking for a reason to remain optimistic), then your best bet is to start with a closer look at the daily chart of the NASDAQ (COMP) (QQQ) - it offers the most hope, beginning with the fact that its major floor at 3576 (black, dashed) held up a couple of weeks ago and managed to dole out a 1.9% advance last week. You can also see that rebound around 3576 was at least partially spurred by the composite's brush with the lower 20-day Bollinger band and the 50-day moving average line. Keep that little detail in your back pocket, since now that both lines have proven themselves as support levels, they may prod another bounce in the future.
NASDAQ Composite & VXN - Daily
This week is going to be fairly busy in terms of data, and much of it is important enough to move the market.
The fireworks start on Tuesday with the newly-featured JOLTS (job openings) data. It's for July, however, so don't worry too much about it. Besides, there's no forecast yet... just be aware that it's coming and other people are going to be watching it.
The really hard-hitting numbers won't come until Thursday and Friday though.
We'll hear August's retail sales on Thursday. Economists expect a 0.4% increase overall, and a 0.3% improvement when taking automobiles out of the equation. That's decent. But, given how fragile things are at this point (economically speaking), there's no room for disappointment here.
On Friday we'll start painting the latest inflation picture, beginning with August's producer price inflation rate. The current annualized PPI rate is a palatable 2.1%, and the pros aren't looking for a big change with this week's update. It should be something of an omen for the consumer inflation rate, due next week. The CPI rate was 1.96% as of the end of July, which isn't "too high". But, it's rising rapidly, well up from April's annualized reading of 1.6%.
Stock Market Index Analysis
Like last week, we're going to have to look as a couple of different indices this week, as certain aspects of all them best explain particular situations we're in. Only by combining all of those ideas can we get a full grip on the market here.
If you're looking for a way to see the glass as half full (that is, if you're looking for a reason to remain optimistic), then your best bet is to start with a closer look at the daily chart of the NASDAQ (COMP) (QQQ) - it offers the most hope, beginning with the fact that its major floor at 3576 (black, dashed) held up a couple of weeks ago and managed to dole out a 1.9% advance last week. You can also see that rebound around 3576 was at least partially spurred by the composite's brush with the lower 20-day Bollinger band and the 50-day moving average line. Keep that little detail in your back pocket, since now that both lines have proven themselves as support levels, they may prod another bounce in the future.
NASDAQ Composite & VXN - Daily
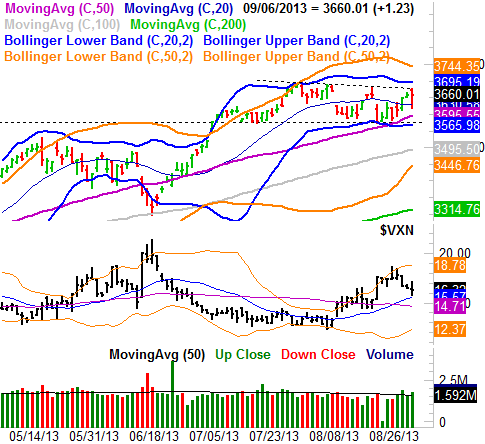 You can also see how the NASDAQ is within striking distance of a break above a recently-developed ceiling at 3677. This ceiling (also black, dashed) tags the composite's last two major peaks, and if the index can clear it, that could be a huge bullish catalyst. The proverbial 'Big Kahuna', however, is 3695, where the NASDAQ's upper 20-day Bollinger band is right now, and pretty much where the index peaked in early August before the weakness materialized. If the NASDAQ Composite can hit a new high here and smash through the upper Bollinger band, it could light a whole new bullish fire.
That being said, it's too early to start celebrating just yet. The S&P 500 (SPX) (SPY) isn't nearly as well-positioned for another round of bullishness as the NASDAQ is.
Yes, the S&P 500 mad progress last week, gaining 1.3% at a point when it looked like it was going to implode; the prior week's cross below the 100-day moving average line (gray) should have been a bearish catalyst. But, it wasn't. The index bounced instead. Problem: That bounce has stopped dead-cold once the 50-day moving average line (purple) was brushed on Friday; the S&P 500 even peeled back from that peak around 1665 to end the session at 1655.17. That retreat suggested the bulls aren't quite as confident as they appeared to be on the chart of the NASDAQ.
S&P 500 & VIX - Daily
You can also see how the NASDAQ is within striking distance of a break above a recently-developed ceiling at 3677. This ceiling (also black, dashed) tags the composite's last two major peaks, and if the index can clear it, that could be a huge bullish catalyst. The proverbial 'Big Kahuna', however, is 3695, where the NASDAQ's upper 20-day Bollinger band is right now, and pretty much where the index peaked in early August before the weakness materialized. If the NASDAQ Composite can hit a new high here and smash through the upper Bollinger band, it could light a whole new bullish fire.
That being said, it's too early to start celebrating just yet. The S&P 500 (SPX) (SPY) isn't nearly as well-positioned for another round of bullishness as the NASDAQ is.
Yes, the S&P 500 mad progress last week, gaining 1.3% at a point when it looked like it was going to implode; the prior week's cross below the 100-day moving average line (gray) should have been a bearish catalyst. But, it wasn't. The index bounced instead. Problem: That bounce has stopped dead-cold once the 50-day moving average line (purple) was brushed on Friday; the S&P 500 even peeled back from that peak around 1665 to end the session at 1655.17. That retreat suggested the bulls aren't quite as confident as they appeared to be on the chart of the NASDAQ.
S&P 500 & VIX - Daily
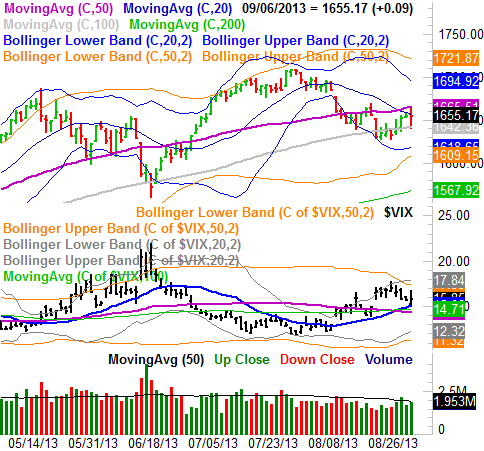 So which is it? Bearish, or bullish? That's just it... given what we know and see right now, the market's next meaningful move is a 50/50 proposition. We'll have to keep watching the major floors and ceilings discussed above. More than anything though, we're going to be watching the volatility indices (VIX) (VXX) for the S&P 500, and (VXN) for the NASDAQ Composite. They too are trapped between a rock and a hard place, but have actually been better indicators as to the market's intentions than the indices themselves have been lately. Given their current - even if wobbly - trends, we're still leaning a tad bearishly. You can see how the S&P 500 Volatility Index was well supported on Friday. That may well lead to a reversal of the VIX this week, which would be bearish for stocks.
Check back next week. By then we should have the clarity that's not part of the equation this week.
Trade Well,
Price Headley
BigTrends.com
1-800-244-8736
So which is it? Bearish, or bullish? That's just it... given what we know and see right now, the market's next meaningful move is a 50/50 proposition. We'll have to keep watching the major floors and ceilings discussed above. More than anything though, we're going to be watching the volatility indices (VIX) (VXX) for the S&P 500, and (VXN) for the NASDAQ Composite. They too are trapped between a rock and a hard place, but have actually been better indicators as to the market's intentions than the indices themselves have been lately. Given their current - even if wobbly - trends, we're still leaning a tad bearishly. You can see how the S&P 500 Volatility Index was well supported on Friday. That may well lead to a reversal of the VIX this week, which would be bearish for stocks.
Check back next week. By then we should have the clarity that's not part of the equation this week.
Trade Well,
Price Headley
BigTrends.com
1-800-244-8736