VIX Line In The Sand - Weekly Market Outlook
Delayed Employment & Real Estate Data, Mediocre Earnings & VIX Line In The Sand - Weekly Market Outlook
True to their implied word, the bulls got back on the horse when the government shutdown ended and a government default was taken off the table. It may not have been the "right" move, but it's clear the bulls were waiting in the wings for the point when the good news was made official.
That doesn't mean the rally was built to last, however. In fact, this rally seems to be heating up at an unsustainable pace, forming a pattern that looks alarmingly like the peak we saw in mid-September. Then again, anything's possible at this point. Between the political tug-of-war, the time of year, earnings season, a Federal Reserve in transition, and more, no possibility can be taken of the table. We'll look at the most important ones in a second, right after a quick look at what's in the backed-up economic queue for this week.
Economic Data
Though the shutdown ended by Thursday, not all of the delayed data has been posted or updated yet. We'll get to those key numbers when and if we can, though at this point there's not a lot of need to worry about it - any economic information more than a couple of days old is already ancient history. That being said, we didn't get anything in the way of economic numbers that mattered last week. The economic data grid simply shows you what we missed.
Economic Calendar
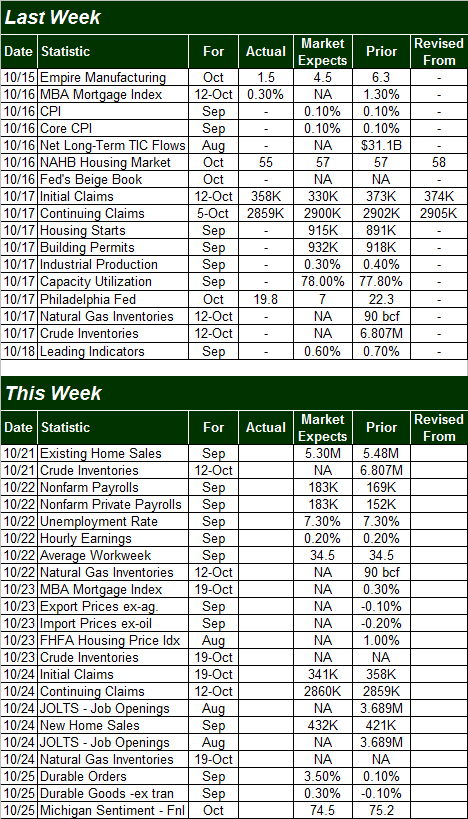
The coming week's economic calendar is chock full, only this time around we'll actually get most (if not all) of the data.
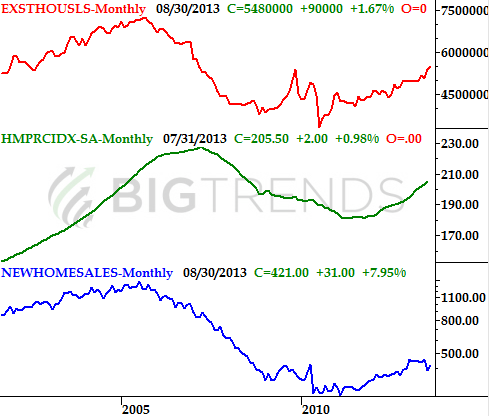
It's going to be a huge week for real estate numbers, kicking off with existing home sales on Monday, followed by the FHFA Housing Price Index on Wednesday, and new home sales levels on Thursday. As you can see on the chart (as of September's reporting of August's data), the bigger real estate picture remains in a strong uptrend. Indeed, it's oddly strong, and one has to wonder if it's setting up a sharp reversal. We can't assume anything, though.
Existing Home Sales, FHFA Price Index, New Home Sales
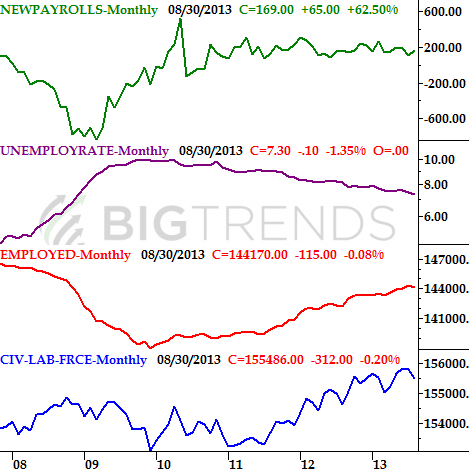
It's also going to be a huge week for employment data, which was pushed back a couple of weeks thanks to the shutdown. Specifically, non-farm payroll growth and September's unemployment rate will be unveiled on Tuesday. We've seen spotty, anemic growth on this front for a while, and we may be in for more of the same this time around. Note that it wouldn't take much of a stumble to make these trends on the chart below look really ugly.
Job Growth, Unemployment Data
Though - and as was noted above - any delayed data that comes out this week (instead of when it should have over the prior couple of weeks) may be irrelevant at this point, that doesn't mean the market won't respond to it when it's posted, even if only for a short while. The biggies on that front may be inflation data, housing starts and building permits, capacity utilization, and industrial production for September. There's still no revised schedule for their release dates and times, which means it could be anytime this week. Just be on the lookout.
Stock Market Index Analysis
The market's momentum is undeniably bullish. The S&P 500 (SPX) (SPY) has gained 5.3% in just the past seven trading days, six of which were bullish. The index advanced 2.7% over the course of the past three trading days alone, marching into record high territory on Friday. Volume wasn't bad between Wednesday and Friday of last week either, fueled by the end of the government shutdown. It is, simply put, a rolling freight train that looks too tempting not to chase.
S&P 500 & VIX - Daily Chart
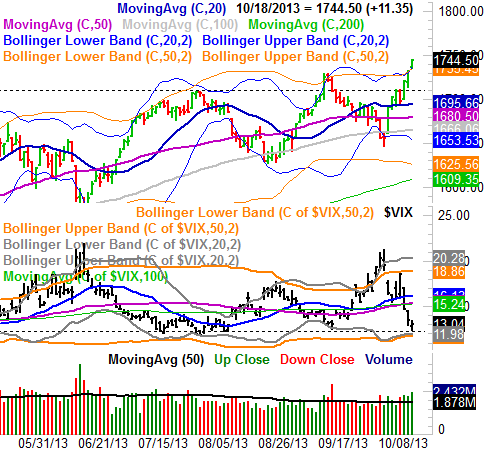
There's just one problem with the "continued bullishness" theory, however - for the market to keep rallying from here, the bulls are asking it to do something it hasn't done in several months... moving above and beyond the upper 20-day and upper 50-day Bollinger band. The S&P 500 closed above both of those band lines on Friday. Yes, it's bullish on the surface, but it's also unusual to the point of being scary, even if we are in the most bullish period of the year.
The CBOE Volatility Index (VIX) (VXX) also brushed a key support level at 12.30 before pushing up again on Friday. Based on the VIX's history at that line in the sand, it's another reason for the bulls to be worried now.
While the VIX's support level is pretty clear on the daily chart, the scope and depth of that support line becomes even more meaningful when you see it on the weekly chart. Take a look.
SPX & VIX - Weekly Chart
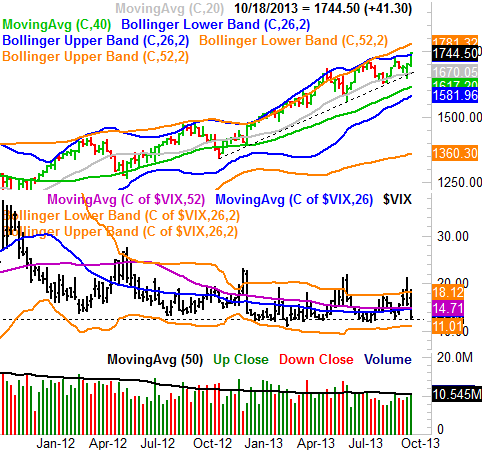
When we say the VIX's absolute line in the sand is 12.30, it's 12.30. The VIX has proven that support repeatedly since January of this year (with just one very brief dip below that level), and when it's done so, things have not been easy for the market. In fact, the market's been hit pretty hard a couple of times the VIX put pressure on its floor.
The point is, there's just not a lot of room for the market to keep moving higher with the VIX in this condition.
The counter-argument is a decent one. While the bulls can't say the market isn't overbought in the very near-term right now, the bulls can say the S&P 500 has yet to break below a key support level around 1670 (where the rising, dashed support line that extends back to last November's low and the gray 100-day moving average line have converged). The VIX could conceivably inch its way higher while the market bleeds off some of this overbought pressure without actually breaking under the S&P 500's key support levels. But, even a retest of the support area around 1670 - which we think is in the cards - would still be a 4.2% dip. No need to ride that out if you don't have to.
Third Quarter Earnings
While we're only about 1/5 of the way through earnings season, so far things have been sub-par. Only about 58% of companies have beat estimates, compared to a norm of around 69%. And, the S&P 500's Q3 earnings figure to-date is about a half a percent below the original estimates (though they're still about 11% stronger than the weak figure from Q3 a year earlier).
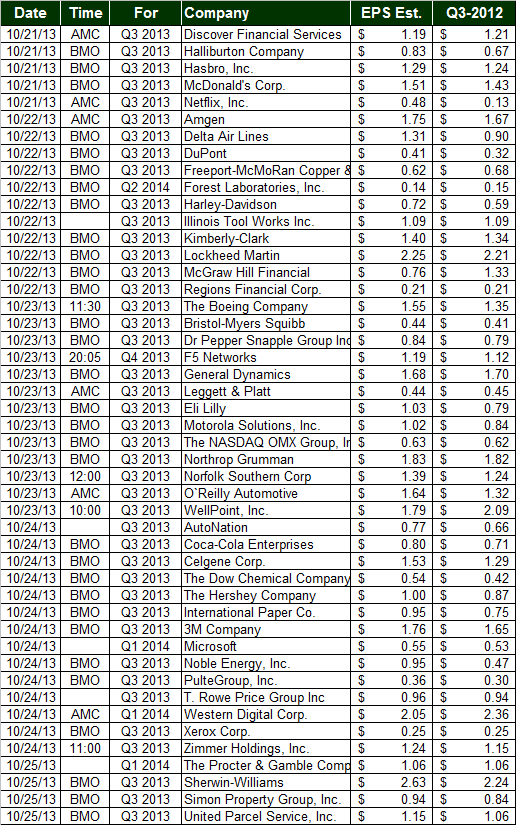
In any case, here's what's in the lineup for the coming week. It's a pretty full schedule.
Earnings Calendar: Oct. 21 through Oct. 28
Trade Well,
Price Headley
BigTrends.com
1-800-244-8736