Triple Top or New All-Time Highs Ahead? - Weekly Market Outlook
Triple Top or New All-Time Highs Ahead? - Weekly Market Outlook
Another winning week... the ninth in the last ten. In fact, all five days last week were bullish, with most stocks near or at all-time highs. From a momentum perspective it's exactly what the bulls want to see. Yet, there's something a little uncomfortable about the sheer size and age of the rally now; the S&P 500 (SPX) (SPY) is up 10.6% since early January. Did the buyers just set up a pullback by pushing stocks a little too far, too fast, or do we take this persistent progress at face value? We'll talk about it below, right after looking at the economy's key numbers.
Economic Calendar
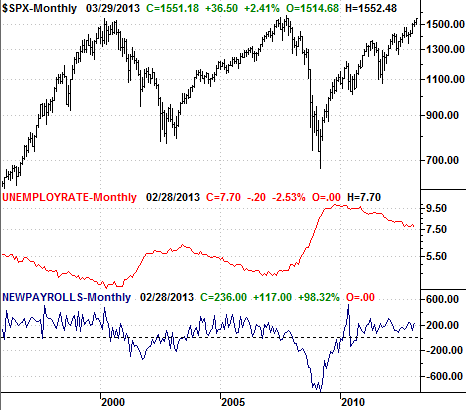
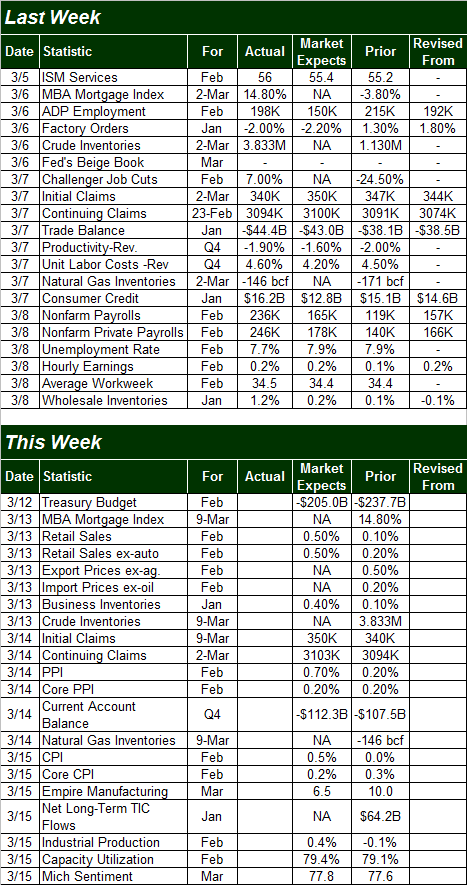
It was a busy week last week in terms of economic data, but there was only one biggie... was last month's unemployment data. The unemployment rate fell from 7.9% in January to 7.7% for February. That's the lowest reading in four years. The Labor Department also said 236,000 new jobs were created; ADP said 198,000 new payrolls were added last month. Though it's measurable progress, the big dip in the unemployment rate may overstate the rate and depth of progress.
S&P 500 Vs. Unemployment Rate & Payroll Creation
 Economic Calendar
 This week is going to be just as busy, so again, we'll just preview the highlights.
The fireworks don't begin until Wednesday, when we hear February's retail sales. Economists say retail spending should be up 0.5%, with or without cars.... Good numbers that would follow a surprisingly strong increase from January's retail sales. Strong spending continues to defy worries that we're re-entering the recession.
On Thursday we'll get last week's unemployment claims numbers, although the modest downtrend in that data has become old hat; it's only tepid progress anyway. The real heavy hitter for Thursday is the producer inflation rate. It could be problematic this time around, with the pros looking for a 0.7% increase in producer's input prices overall, and a 0.2% increase on a core (ex food and energy) basis. The current annualized PPI 'rate' is 1.4%.
On Friday we'll round out the look at inflation with February's CPI data. The pros are expecting a 0.5% increase in overall consumer prices, and a 0.2% increase on a core basis. The current annualized inflation rate stands at 1.59%.
It's the other data on Friday, however, that has the biggest impact on the long-term market trend... industrial production and capacity utilization. Both are expected to have improved a little from January's numbers, which is bullish.
Stock Market
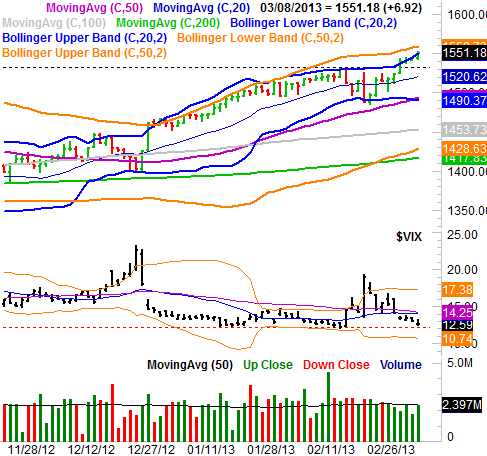
After Tuesday's big surge to new multi-year highs on Tuesday, there was no looking back. Although the pace of progress slowed from Wednesday on, the bulls never backed down, and Friday's bullish volume was surprisingly strong heading into the weekend. When it was all said and done, the S&P 500 gained 32.98 points (+2.2%) last week, closing at 1551.18. The bulls didn't seem to balk too much at bumping into the upper 20-day Bollinger band (blue) either, pushing it higher over the last four days of last week.
It's not like there's nothing that can't trip stocks up from here, however. The biggest concern at this point is the upper 50-day Bollinger band (orange) at 1559.7. It's capped rallies whenever the 20-day Bollinger bands haven't, so there may only be room for about eight more points' worth of gain here. On the other hand, note that an encounter with the upper Bollinger bands doesn't necessarily mean a bearish reversal materializes right away. It could just mean the rally slows. Take a look.
S&P 500 & VIX - Daily
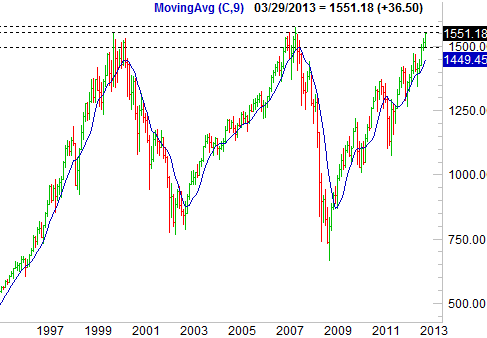
 The bigger concern with the S&P 500 at this point is something you can't see on the daily chart... the all-time high of 1576.09, from October of 2007. The March 2000 peak at 1552.87 is likely coming into play as well, psychologically.
Past major peaks tend to be major hurdles once revisited; traders start to act squirrelly around them. Many traders assume those ceilings will repeat themselves as tops, and then end up making that theory happen by selling stocks once those levels are brushed [a self-fulfilling prophecy]. Yet, traders frequently think the market's indices must reach those past peaks - or thereabouts - to put any looming pullback into motion.
In other words, the S&P 500 may actually need to brush one of those prior peaks or move to some point between them (between 1552.87 and 1576.09) to begin the subsequent pullback. Traders will work to make that happen too.
Well, we're there. The close at 1551.18 on Friday as well as that day's high of 1552.48 means we're just one more bullish nudge away from reaching that inflection point.
That's not to say a pullback is inevitable. It is to say that if that's what's in the cards, we're at the point where it's most likely to materialize, and catch a bunch of traders/investors off-guard. More than that, after a 10-week, 10.6% gain, the would-be profit-takers are starting to get a little antsy. So, while the momentum is technically bullish, there's a lot that could pull the rug out from underneath the market here.
Our bottom line:
The trend remains bullish, but we're very cautious here - the market's (DIA) (QQQ) (IWM) very vulnerable. If stocks really are ready to walk into new all-time high territory, they'll need to establish a technical base first. The good news is, there's plenty of support relatively close that could buy the market time to do just that. The converged lower 20-day Bollinger band and the 50-day moving average line at 1490 is that first floor, and a floor at 1453 will be formed when the lower 50-day Bollinger band intercepts the 100-day line there in a few days. Of course, if the S&P 500 has to test or use those lines while building a longer-term base, that'll still mean a 3.8% or a 6.3% dip, respectively. That's not ideal (for the bulls), but it could be a lot worse.
The worst-case scenario is, this brush with the same level where the last two major tops were made could end up being the beginning of a major triple top.
We'll just have to wait and see how this pans out.
Here's the weekly chart that shows how that potential triple top could be forming.
S&P 500 - Monthly
 Trade Well,
Price Headley
BigTrends.com
1-800-244-8736

