This Last-Minute Bullishness for Barack Obama's Second Term, President-Elect Trump Isn't Unusual
Think the bullishness since Donald Trump's election has been oddly bullish? It's been an oversized gain to be sure, but nothing terribly shocking. In fact, as overbought as the market may still be even after Wednesday's stumble on the heels of the Fed's rate hike, history says that a significant correction isn't necessarily in the cards.
Yes, as far as the market's average performance over the course of any given year goes, December is generally a fruitful month; the average gain for the last month of the year is right at 1.5%. What's largely unappreciated is that the stock market has a discernible cycle that corresponds to the four-year Presidential cycle as well. And, during the last full month of the last year of a Presidential term, the S&P 500 gains about 1.6%... and makes that gain whether or not the year is bullish, bearish, or just average.
With that as the backdrop, while the past four years under Barack Obama have been bullish overall for the market, they've not been oddly bullish. The 55% or so the S&P 500 has gained since the beginning of 2013 is actually about the normal pace for a bull market's results during the fourth year of a four-year term. In fact, we've seen even better market performance during some Presidential terms.
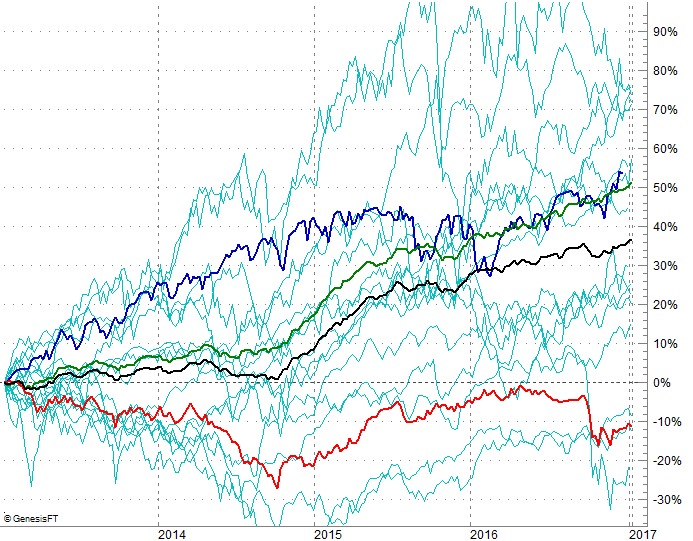
The chart below tells the tale. The red line denotes the average market return for a Presidential term when the market loses ground during that stretch; there aren't many bear markets that last that long. The black plot traces the average result for the S&P 500 during the typical Presidency. The green line marks the average gain for any term where the net result is a again. And, the blue line indicates the S&P 500's performance since the beginning of President Obama's second term. This has been a fairly typical second-term bull market gain. [The thin, aqua-colored lines plot the S&P 500's results for every single Presidential cycle; those are used to calculate the averages.]
Point being, as overextended as things may feel right now, this actually isn't anything terribly unusual. We can't preclude the possibility that stocks may well rebound from Wednesday's lull.
On the flipside, the market loves to, and lives to, do the unexpected and unusual.
The X-factor, of course, is what traders will make of the Fed's unexpected plans to impose three rate increases in 2017 rather than the widely-presumed two increases. The economy can survive it. Indeed, even with three rate hikes in 2017, interest rates will still be closer to historical lows than not. It's got bad "optics" and psychology though, meaning the very act/chatter of rising interest rates leaves the market vulnerable to investor worry... even though there's no empirical modern-day evidence that the market's perform poorly - or even underperform - in a cycle of rising rates.
Whatever's in the cards for the rest of December, know that even for Presidential terms that end with a gain, most of these four-year stretches don't start out well. The average S&P 500 performance indicates a 1.3% loss between the beginning of the year and mid-March. This is true even for terms where the market is decidedly bullish for the timeframe. President Obama's bullish start to his second term was an anomaly.