The Trend Is Your Friend (Until It Isn't) - Weekly Market Outlook
The Trend Is Your Friend (Until It Isn't) - Weekly Market Outlook
1775 SPX Level Has Become Key
On Thursday of last week, with the market down a nasty 1.2%, it looked like the long-overdue correction was finally going to make landfall. On Friday, the bulls one again defied the odds and fully unwound that big loss, reigniting the bigger bullish undertow. It wasn't a big weekly gain, but Friday's pop led stocks to their fifth straight week of progress.
So now what? As they say, the trend is your friend (until it isn't), so we have to remain cautiously in the bullish camp. On the flipside, it would be irresponsible to not note how and where this really could still be up-ended.
We'll cross that bridge in a moment. The first thing we need to do is work our way through last week's major economic numbers, with the employment snapshot being the centerpiece of those numbers.
Economic Data
Though the creation of 204,000 new payrolls last month thrilled investors, last month's employment data may not look as solid when you look under the hood. This time around, the slight uptick in the unemployment rate from 7.2% to 7.3% shouldn't have been dismissed as a mathematical inconvenience. The number of people who actually have jobs in the United States actually fell by 740,000, and the number of people who are unemployed but want jobs was up a tad too. Meanwhile, the number of people who technically fell out of the labor force reached 720,000. Usually when the labor force shrinks to a large degree, it actually helps LOWER the unemployment rate (since the unemployment rate is based on a comparison to the actual labor force). To see the unemployment rate rise when the labor force shrinks dramatically, however, points to bigger problems that weren't indicated by the 204,000 new jobs; that figure of 204,000 is clearly based on a very small and somewhat meaningless set of numbers. Things aren't nearly as strong as the payroll-growth rate suggested in October.
Employment Snapshot
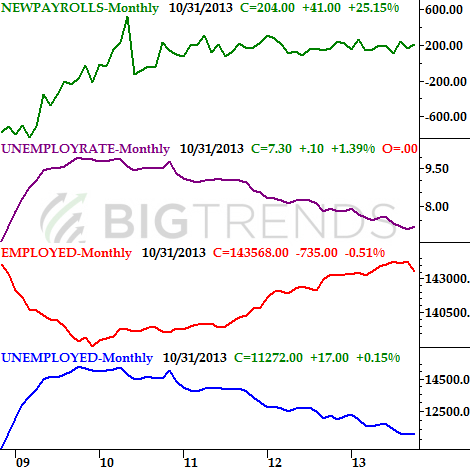
Unemployment numbers weren't the only important data posted last week, however. We also got a surprisingly-strong initial reading for Q3's GDP growth rate. It rolled in at 2.8%, topping estimates of 1.9%. Maybe the economy isn't as tepid as many thought it was after all. That's actually an increase from the 2.5% growth rate for Q2.
Everything else is on the following grid, though note that much of it is September's data (thanks to the government shutdown in the first half of October). That's ancient history when you're talking about the stock market.
Economic Calendar
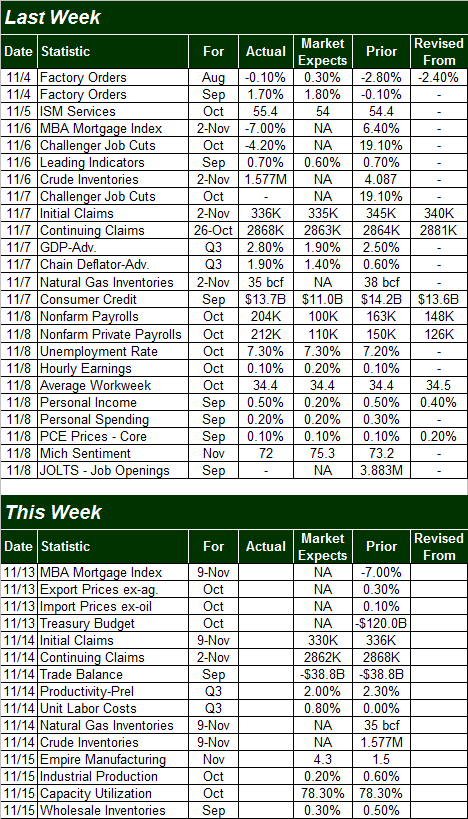
The coming week is going to be a little less busy for economic reports, and most of this week's information isn't all that hard-hitting. The only biggies we're concerned with are Friday's capacity utilization and industrial production, for October. Both grew a little for September, underscoring the bigger bull market for stocks. But, it will be interesting to see if the government shutdown stifled those data points last month . If they slump, it might be a dismissible, one-time event. If they grow despite the shutdown, then that'll be a sign the economy is humming even when some traders think it shouldn't be... a huge long-term buying prompt.
Stock Market Index Analysis
On Thursday it looked like we were finally going to get that pullback that usually happens when the S&P 500 (SPX) (SPY) gets a little overextended and bumps into one or both of its upper Bollinger bands. The selloff was fueled by good economic news, prompting assumptions that the Federal Reserve may end its simulative efforts sooner than first expected. We should have gotten at least a little suspicious that day, however, when the selloff stopped exactly at the 20-day moving average line. Sure enough, that very same moving average line turned into support and a pushoff point on Friday, recovering everything that was lost on Thursday. The volume behind the move wasn't too shabby either. Take a look.
S&P 500 & VIX Daily Chart
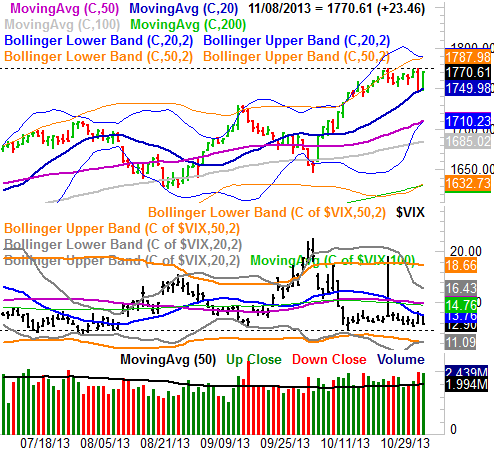
So we're back in bullish mode? It might be a precarious one, but yes, that's the assumption we have to make. If there was ever a time to exercise some healthy skepticism though, this is it - there are a couple of very easy ways the bulls could hit a wall here.
One of them is the horizontal resistance line (dashed) at 1775.0, which was not only touched once a couple of weeks ago, but was also last week's high, prodding a nasty - even if temporary - pullback. The other stumbling block is one or the other upper Bollinger bands, which right now are one and the same, converged at 1788. You don't have to look too far back on the chart to realize the upper Bollinger bands have been major reversal points. There's a third looming problem on the chart too... the CBOE Volatility Index (VIX) (VXX) is back to uncomfortably-low levels. Currently at 12.90, it's within striking distance of its major floor (also dashed) at 12.30, which tends to get hit right as the market is making a near-term top.
The idea doesn't really change when you zoom out to a weekly chart of the S&P 500. But, we do get some perspective on how rough things might get if the bulls end up giving into the bears here - it likely won't be all that bad. There's still a huge floor currently at 1691, made up by the now-converged 100-day moving average line as well as a long-term straight-line support level (dashed) that tags all the major lows all the way back to late-2012.
SPX & VIX - Weekly Chart
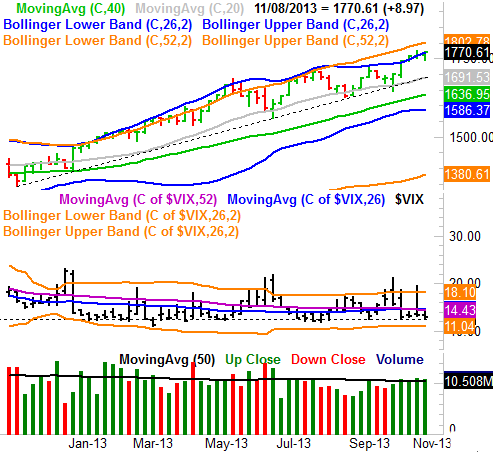
Not that it's going to happen anytime soon (but not that it won't), should the S&P 500 fall all the way back to the 1691 area sometime soon, that's only going to be about a 4.5% pullback from the recent high around 1775. That's not chump-change, but it's still not a hard-hitting, major-bottom-making kind of plunge. We really need a correction of 10% or more to really clear the decks and set up a huge, prolonged rally. Until we get that, we're apt to keep getting this erratic "fits and starts" bullish kind of action that's been nagging the market since the middle of the year. A dip all the way back to the 200-day moving average line (green) or even the lower 26-week Bollinger band at 1586 would do us wonders. Just because we want it doesn't mean we'll get it though.
Trade Well,
Price Headley
BigTrends.com
1-800-244-8736