The Shooting Star Japanese Candlestick Chart Pattern
Candlestick Trading Patterns: Shooting Star
While a stock's or index's momentum can be compelling to a trader, unexpected reversals can quickly wreak havoc on what appeared to be a smart decision. One effective way to spot potential reversals is by careful review of the shape of the bars of that trend. Specifically, one can glean a great deal of subtle information from a chart by looking closely at the position of one bar's opening, high, low, and closing price, and where they lie in relation to one another. And, when those four pieces of information form what's called a shooting star, a reversal of a bullish trend into a bearish one is likely.
A shooting star candlestick pattern consists of an open and a close near the low for that particular bar... an open and close well under (ideally) a very high high for the day. But, it's generally only a shooting star if it occurs after a prolonged rally has been made.
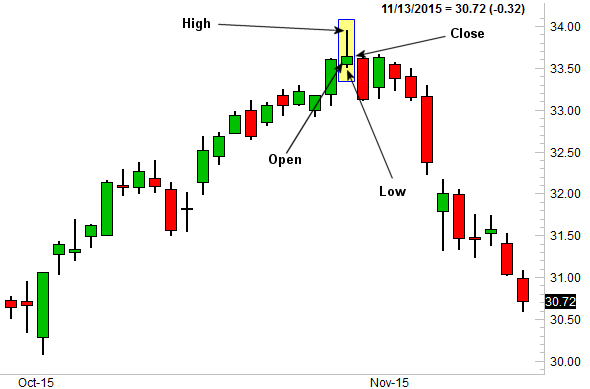
The example below will clarify the concept of a shooting star, highlighted in yellow. After this stock rallied well for several weeks, the rally ran out of gas. The open and close on the pivotal day seemed nominal, but the retreat from the high and the close near the low suggests the last of the buyers had trickled in and that the sellers were finally starting to take over again.
It's a powerful pattern, though not one with a 100% success rate. It's generally best to wait for a confirming clue after the shooting star bar has formed. Namely, the chart needs to make a lower close the next day (or the next bar, if using intraday charts). It should also be noted that the longer and bigger the rally preceding the shooting star pattern is, the more reliable the reversal is once the pattern is formed.