The Real Employment Picture Isn't As Rosy As You Might Think - Weekly Market Outlook
The Real Employment Picture Isn't As Rosy As You Might Think - Weekly Market Outlook
Without a day to spare, the bulls stepped up to the plate on Friday, undoing some pretty big technical damage the market had suffered over the course of the first four days of the week. Will it be enough to reignite the uptrend that's been in place for nearly two months now? Maybe, though it's tough to imagine the market tacking on any more gains after already rallying 9.0% since October 9th. At this point, the market looks like a perfect 50/50 proposition.
We'll look at the upside and the downside (and the odds of both) in a moment. Let's get the economic data out of the way first.
Economic Calendar
Whew! What a week. Not only was it loaded with the normal economic numbers for the first week of the month, but we got an extra dose of data as the government continues to play catch up with the data delayed by October's government shutdown.
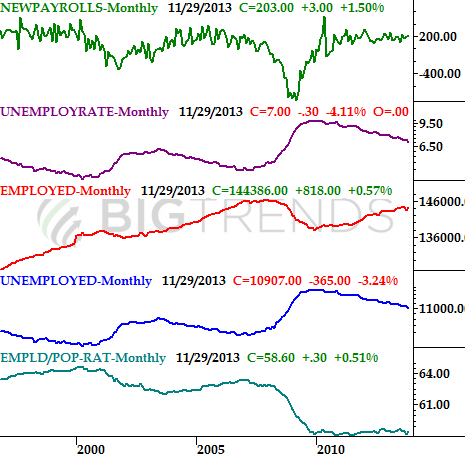
The highlight for the week, of course, was November's employment numbers. The unemployment rate fell from 7.3% to 7.0%, and the DOL says 203,000 new jobs were created last month. As has been the case for a while, however, the numbers touted by the media don't tell the whole story.
While jobs were mathematically created last month, the 144.38 million people that are working now is only a tad better than the 144.30 million people that had a job in September. In other words, the only thing November's job growth did was offset October's loss, and add about 80,000 more new jobs. All told, 58.6% of the population is now employed, which is better than the multi-year low of 58.3% hit it October. But, it's still near multi-year lows, and still not nearly as strong as it needs to be to get the economy off of life support (though the Fed seems keen on tapering soon anyway).
Employment Snapshot
The employment snapshot wasn't the only big number posted last week, however. We also heard the second estimate of Q3's GDP growth, and we got caught up on our delayed new-home sales information.
As for third quarter's economic growth, the second guess said the GDP increased by 3.6% (year-over-year), walloping the prior estimate of 2.8%. The third and final reading will be out late this month, though it's a rarity to see a dramatic change between the second and third estimate. It is an oddly-high reading, however.
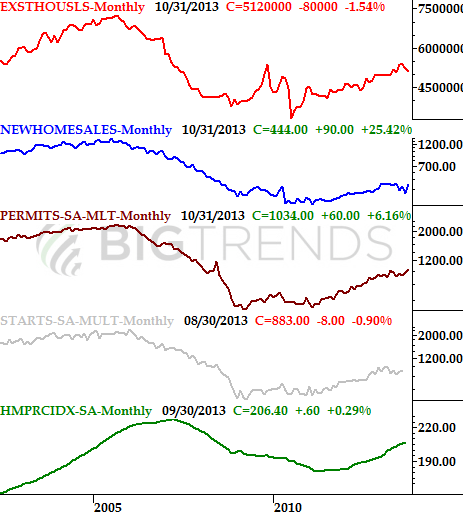
The new-home sales numbers rounded out the look at the real estate report card that got started (and got mostly completed) a week earlier. The pace fell to 354,000 in September, probably thanks to the shutdown, but perked back up to 444,000 for October. The real estate market remains solid, even if not red hot.
Real Estate/Construction
Economic Calendar
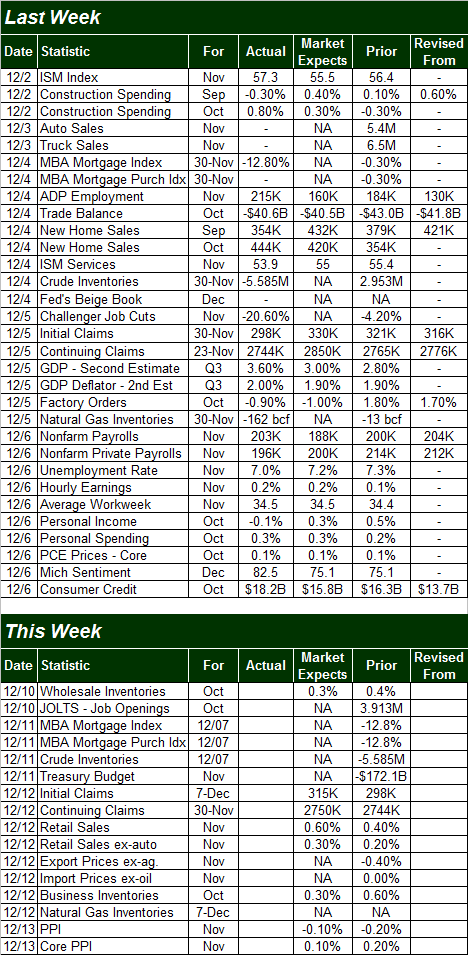
Truth be told, not only are we not getting much in the way of economic data this week, very little of what we're getting is of any importance.
Last month's retail sales will be reported on Thursday. They're expected to be up, but one has to wonder if a lethargic Black Friday weekend is going to set up a disappointment. If the results fall short of expectations, already-concerned investors may decide there's too much risk at the market's current values.
Also note that we start processing and posting last month's inflation data, beginning with the producer prince index on Friday. The consumer inflation data will be out early next week.
Stock Market Index Analysis
Bottom line, the short-term market directional bet is an uncertain one currently.
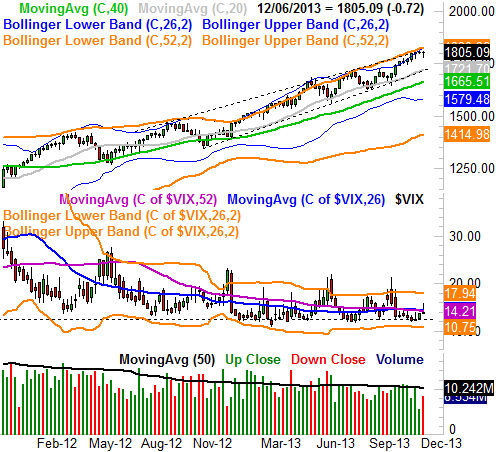
The S&P 500 (SPX) (SPY) had fully crossed a bearish line on Thursday, but surprisingly good employment news on Friday (though Thursday's surprisingly good GDP figure helped) prodded a big wave of bullishness. The move undid almost all the damage done over the course of the first four days of the week; the S&P 500 only ended up closing down by 0.72 points last week, at 1805.09. There's no way of knowing for sure, however, if the bulls are going to be in the same good mood this week. Remember, it was only one day earlier that investors were more than willing to shed - en masse - the very stocks they were buying on Friday. Point being, we won't know until today (and maybe not even until later this week) if Friday was a fluke or if Friday was an indication of a renewed uptrend. Take a look at the daily chart.
S&P 500 & VIX - Daily Chart
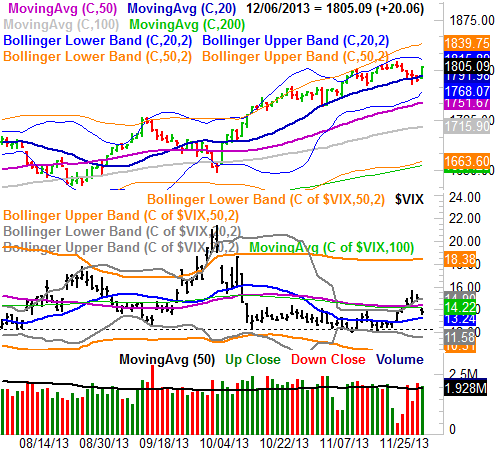
With all of that being said, if we strictly adhere to a scientific interpretation of the chart as it stands right now, then we have to assume the market's current direction is bullish. The S&P 500 closed back above the 20-day moving average line on Friday, and that's "the" key indicator line for the near-term trend.
On the flipside, there are a couple of things that could trip-up the uptrend this week. One of them is the fact that the CBOE Volatility Index (VIX) (VXX) left behind a big gap with its plunge on Friday. Since the market doesn't like to leave gaps unfilled, this could put upward pressure on the VIX this week, and put corresponding downward pressure on the market.
There's something else that could also quickly get in the way of the S&P 500's current rally, though it won't be in the way until we rise a little further. It's the upper 20-day Bollinger band, currently at 1816, and falling fast. It's got a 50/50 shot at actually halting and reversing the uptrend, but those odds are high enough to remain on the fence until we get some much-needed clarity on the market's true intentions here.
Nothing really changes when you zoom out to a weekly chart of the S&P 500. You can see on the weekly chart, however, how the S&P 500 is really starting to feel the weight of all its gains. There's a lot of resistance all around the 1819 area.
S&P 500 & VIX - Weekly Chart
Whatever's in the cards for stocks here, it's going to be pretty clear by the end of the week. The 20-day moving average is the make-or-break line. Just bear in mind that for the S&P 500, by the time the 20-day moving average line (currently at 1792) is truly tested, the lower 20-day Bollinger band could be right there to help act as a floor. We can't worry about any downside move or downside target until those lines fail.
Trade Well,
Price Headley
BigTrends.com
1-800-244-8736