Real Estate is Pacing the Economy - Weekly Market Outlook
Real Estate is Pacing the Economy - Weekly Market Outlook
Despite Friday's bounce, the market still closed in the red for the week... the first losing week in the last four. The push off the low for the week (hit on Tuesday) offers a glimmer of hope for the bulls, when you take a step back and look at the longer-term chart, red flags are still waving.
We'll take that step back and dissect the market's red flags below, right after we lay the foundation by looking at last week's and this week's economic data.
Economic Calendar
It wasn't a terribly busy week last week in terms of economic numbers, but some of the data we got was more than a little important.
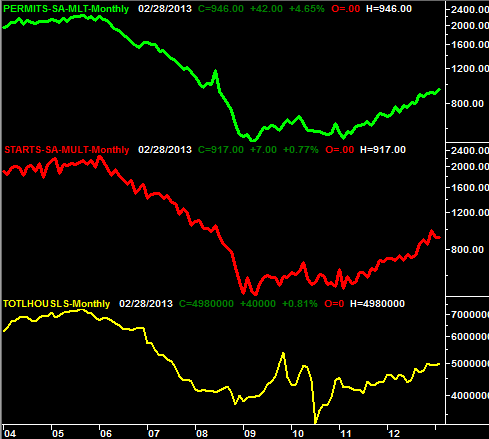
Take housing starts and building permits for example. They once again came in strong, extending a growth streak that's been in place for more than a couple of years now. New homes were started at an annual pace of 917,000, and permits were issued at an annual pace of 946,000. FHFA underscored that encouraging new-home sales data, saying prices rose 0.6% in January. The National Association of Realtors bolstered the encouraging real estate news by letting us know that existing home sales reached an annual pace of 4.98 million units... also a new multi-year high. It's getting difficult to say real estate's strength is just a temporary blip. Some of the most active Real Estate related ETFs are SPDR Homebuilders (XHB), iShares Construction (ITB), and iShares Real Estate (IYR).
Housing Starts, Permits, Existing Home Sales
 The only other domestic item of real interest last week was a non-event - the Federal Reserve is maintaining its base interest rate of 0.25%. That's not surprising. More important, the Fed assured us it would continue to be accommodative and supportive for the indefinite future. Though the economy is at least self-sustaining at this point in time, tepid employment and wobbly corporate earnings growth implies the recovery effort is still in need of the Fed's help. That's good news at least for the remainder of 2013.
Everything else is on the grid below.
Economic Calendar
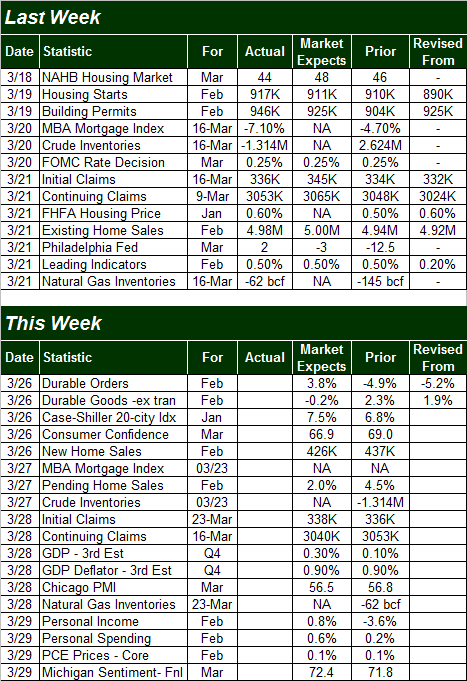 This week is going to be a little busier, particularly on Tuesday. Most of the data could be market-moving, too. Here's a look.
Tuesday's party starts with durable orders. They should be up 3.8%, but only because of a big upswing in demand for planes, trains, and automobiles. Without transportation orders, durable orders are actually expected to fall 0.2%.
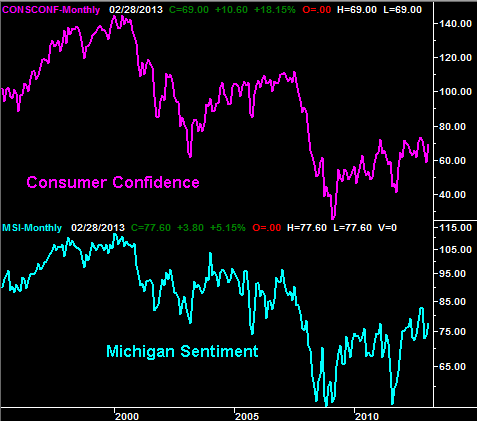
We'll also get a thorough glimpse of how consumers are feeling right now. The Conference Board's consumer confidence number will be unveiled on Tuesday; the pros are expecting a score of 66.9, down from January's reading of 69.0. The Michigan Sentiment Index final reading for March will be posted on Friday; economists are looking for a score of 72.4, which will actually be down from February's 77.6. It's interesting that both are slumping now, in the shadow of what's been a pretty good month for stocks [despite last week's modest slide].
Consumer Sentiment
 Tuesday will also give us last month's new home sales pace (which is different than starts and permits, though they all move in tandem) . Economists expect an annualized rate of 426,000, which will be a slight decline from January's pace of 437,000.
And Thursday's final GDP growth rate for Q4? It'll be interesting, but a little irrelevant at this point. We're almost done with the following quarter, and this is the third time we've heard the number... an initial guess, and two revisions. The market pretty much knows where the data stands now.
Stock Market
We're going to start this week with a longer-term look at the S&P 500 (SPX) (SPY), using a weekly chart for some perspective.
At first glance, it looks like the market's uptrend is still going strong. Looks can be deceiving though.
The issue isn't direction or trend; the market's bullish trend lines are intact. One of those lines is the rising support line (dashed) that extends all the way back to November's bottom. But, mostly the uptrend remains tightly framed between the rising 50-day moving average (purple) and the rising upper 26-week Bollinger band (blue). That's bullish. However, the S&P 500 has been in this bullish 'zone' for thirteen weeks now, which is about as long as it can rally before taking a break... in the form of a move under the 50-day moving average line [or under that dashed support line].
S&P 500 & VIX - Weekly
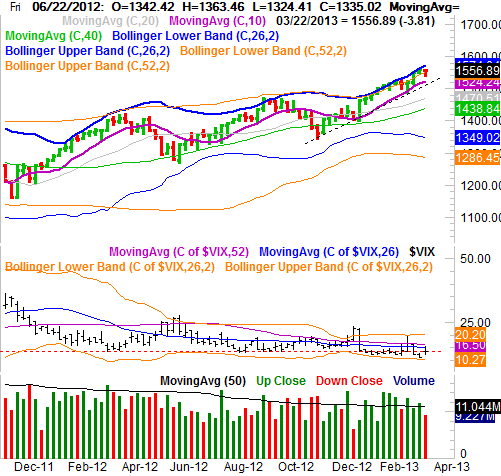 How do we know the S&P 500's rally has gotten uncomfortably long in the tooth? Because that's about how long the market rallied in early 2012 and then again in the third quarter of 2012 before doling out major pullbacks. And by 'major', we mean a dip of 9% or more from the high to the low. Both pullbacks carried the index well below its 50-day moving average line.
For perspective, a 9% contraction from the high of 1563 two weeks ago would bring the S&P 500 to the 1422 area.
On the other hand, just because a chart has a historical tendency doesn't mean that's the way things are going to materialize this time around. Until the S&P 500 actually breaks under 1520, the case for the pullback is only a hypothetical.
Does anything change when we zoom into a daily chart? Not really, though we can see things in more detail in the daily timeframe. On the daily chart, for instance, we can see that long-term support line is at 1525, and the 50-day moving average line is at 1516 (though both are rising). That layering of key moving averages and support lines translates into a whole swatch of potential support, between 1539 where the 20-day average line is to the 1516 level. That's going to make it tough for the bears to do the damage we were talking about above.... though they've done that damage before.
S&P 500 & VIX - Daily
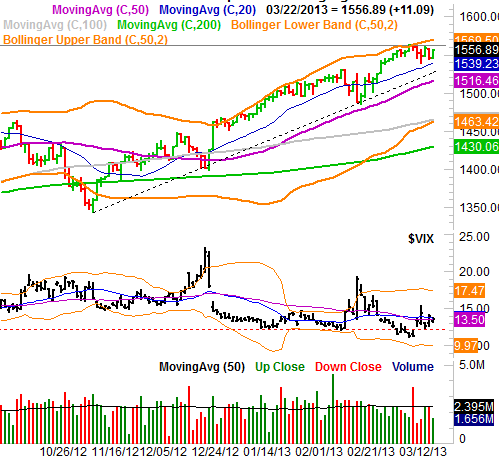 Though it's the less likely outcome from here, a move above the recent peak price of 1563 could spark another wave of buying. Just don't dig in too deep if you want to ride that wave.
As we mentioned a couple of weeks ago, the S&P 500 is dancing suspiciously close with its all-time high of 1576.09, hit back in October of 2007. It's also starting to struggle with the major peak before the 2007 peak... the high of 1552.87, from April of 2000. For reference, the recent peak from two weeks ago was 1563.62 - right between the last two major peaks. That's not likely to be mere coincidence. Most likely, traders are fighting a real psychological battle here, waiting to see if we form that dreaded triple-top, or blast through to new all-time highs. In that respect, the stall we've seen over the past two weeks is not surprising at all.
S&P 500 & VIX - Monthly
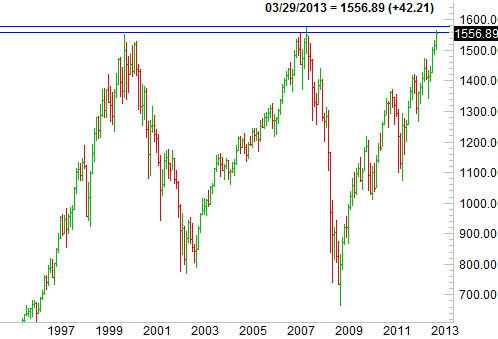 Though we don't see a major bear market forming like we saw the last two times the S&P 500 reached the 1560-ish area, we're thinking a decent pullback is forming here before we move on to new all-time highs. That's not necessarily a bad thing for the long-termers - we need to bleed off some of the overbought pressure before moving on, because we don't want to start that breakout feeling the full weight of our recent gains. But, for the short-termers, we're still nowhere near what would be the likely (and healthy) short-term bottom.
Trade Well,
Price Headley
BigTrends.com
1-800-244-8736

