Plenty On Tap For The Week Ahead - Weekly Market Outlook
Plenty On Tap For The Week Ahead - Weekly Market Outlook
Thanks to a huge Thursday rally, the S&P 500 (SPX) (SPY) ended the first weak of earnings season up 48.3 points, or +2.96%. It was the second winning week in a row, and the close of 1680.19 on Friday was the highest close ever. The S&P 500 didn't make an all-time high last week, however. The all-time high of 1687.18 was reached in late May, and it's still not been touched again.
Are we en route to meeting and surpassing that prior high? Perhaps, although it's having a tough time dealing with a major hurdle between here and there. We'll explain what that impasse is after taking a closer look at the economic underpinnings in play right now.
Economic Calendar
There wasn't much in the way of economic news last week, and even then little of it was important. Perhaps the most important economic announcement for the prior week wasn't data, but rather, color. Federal Reserve Chairman came out and said - and somewhat in conflict with prior hints from the Fed - that the nation's central bank was in no particular hurry to quell its QE efforts. The media realigned its message after that to suggest he'd/they'd be dovish into 2014.
Aside from the Fed's clarification, there were only two other items of real interest - June's producer price inflation rate, and the Michigan Sentiment Index's first reading for July.
Last month, producers (factories, assemblers, fabricators, etc.) saw a 2.5% increase in year-over-year input prices; most of it stemmed from an increase in energy prices. That's a relatively big bump-up from May's 1.7% annualized increase, though even at 2.5% it's still a palatable increase. More important, it's a precursor to this week's consumer inflation rate. More on that below.
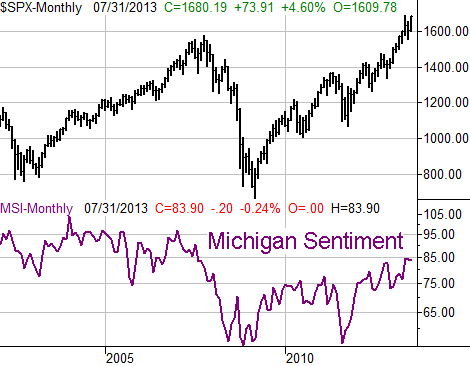
The other major news item on the economic front last week wasn't as major as the media was making it out to be. The Michigan Sentiment Index fell from June's final reading of 84.1 to an initial July reading of 83.9. No, it's not a step in the right direction, but it's still a high reading, and that July number is going to be revised two more times before it's all said and done... and those revisions are generally pretty good sized ones.
Michigan Sentiment Index Chart
 Everything else is on the grid below.
Economic Calendar
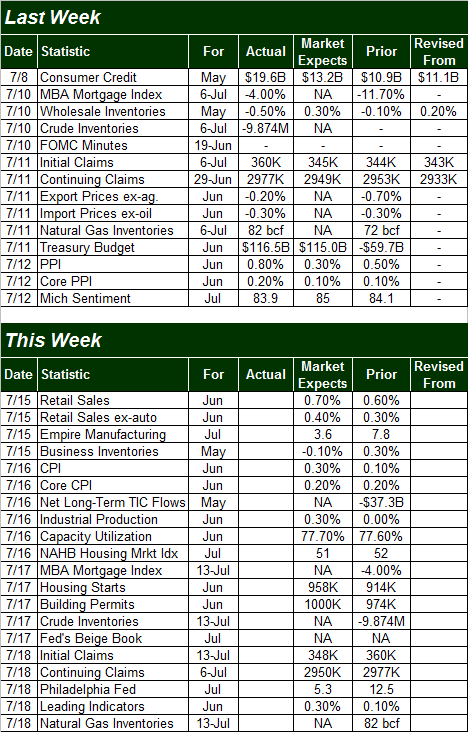 This week is going to be considerably busier, kicking off with Monday's retail sales report for last month. The pros are looking for a month-to-month increase of 0.4% without counting cars (+0.7% with auto sales), which is a pretty good jump. This report will set the tone for the week. A big beat could spur even more buying, and a big disappointment may deflate the recent runup from the market.
On Tuesday we'll get the rest of the inflation story, with June's consumer price index change. Remember, the producer price index jumped from 1.7% in May to 2.5% in June, so we should see a similarly-sized increase for the CPI figure. As it stands right now, the annualized consumer price index rate of change (for May) is 1.36%. Even a big bump in that number would still leave the inflation rate at tolerable - even healthy - levels.
Also on Tuesday we'll get last month's industrial production and capacity utilization figures. You may recall that both have been weak, if not falling, the last couple of months. They've not been drastic slides, but all big trends start as small ones (which is particularly troubling on this front, since the correlation between the long-term market and these two data sets is very strong).
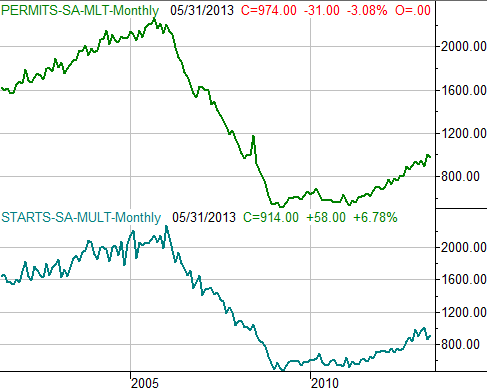
On Wednesday we kick off a wave of housing data that will last through next week. The lead-off batters are housing starts and building permits. The pros think the former will improve from a rate of 914,000 to 958,000, while the latter's on pace to grow from 974,000 to 1,000,000 per year. As you can see on the chart, both have been trending upward for a couple of years, though the starts figure stumbled a couple of months ago. While both trends are getting long in the tooth and are vulnerable, for now, both are also pointed in the right direction.
Housing Starts, Building Permits Chart
 Stock Market
With three good weeks under our belt, it would be easy to be bullish here. Thing is, the market didn't have to contend with any meaningful ceilings until last week. Indeed, the S&P 500's rally did start to slow down on Thursday and Friday when that resistance was finally met. That resistance is coming from the now-converged upper 20-day and 50-day Bollinger bands at 1680.
Just because the S&P 500 and other indices are slowing here at a known ceiling does not inherently mean the market's going to reverse course and pull back here. The SPX bumped into the same upper band lines in early May, and then forced both of those lines upward again ... giving the index plenty of room to reach that new all-time high of 1687.18 later in the month. But, that outcome was an exception to the norm rather than the norm. As overextended as the index is after the three-week runup, traders may be hesitant again, not sure if stocks are really ready blast past a key ceiling. It's going to take some good economic news this week to really inspire that kind of bullish willingness.
S&P 500 & VIX - Daily
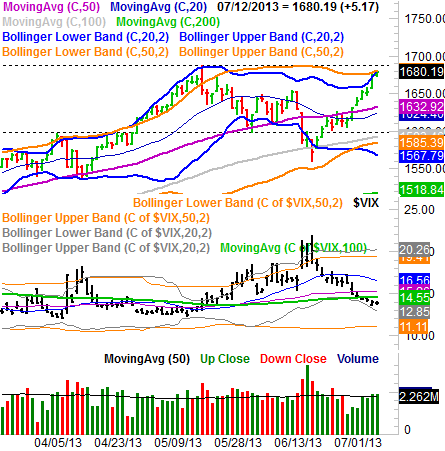 As you can also see - and this is critical - the amount of buying volume as the rally developed last week actually grew. It's still "just average", but even average from here gives the market a fighting chance to break above its bigger-picture ceiling.
The ceiling around the 1680/1690 area shows up on the weekly chart's Bollinger band too, though there's something more (broadly) encouraging about the weekly chart.
For starters, on the weekly chart the S&P 500 is only about halfway into its long-term rising channel (framed by dashed lines). The upper edge of that bullish channel is around 1775, and while that would be a phenomenal move for the market during the summer, it's not out of the realm of possibility for stocks, given some time.
S&P 500 & VIX - Weekly
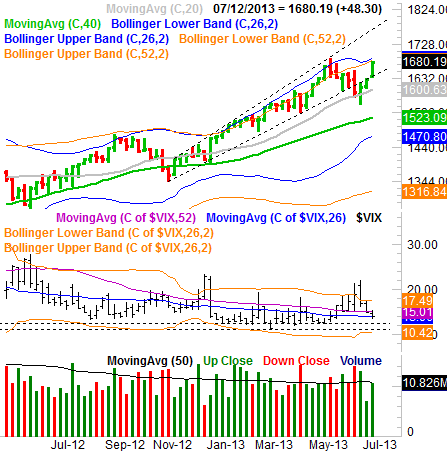 It's also on the weekly chart we can tell that, hey, the CBOE Volatility Index (VIX) (VXX) isn't as alarmingly low as it may seem like it is in the daily timeframe. There's still plenty of room for the VIX to move from its current level before the more important floors at 12.40 and 11.00 could be tested.
The bottom line is, this week is a pivotal week, and the odds of further upside are about the same as new downside. Even if we do get a pullback though, don't panic. There's a floor developing around 1632 on the daily chart, and should bring a quick end to any dip and rekindle the bigger rally. A pullback like that would take about a week to complete, so we may be discussing how it's playing out next week.
Trade Well,
Price Headley
BigTrends.com
1-800-244-8736
