Pivotal Week Ahead - Weekly Market Outlook
Pivotal Week Ahead - Weekly Market Outlook
Kudos to the bulls for quickly stopping the bleeding after Wednesday's decimation; the market didn't really budge on Thursday or Friday. On the other hand, the damage has been done. Was it enough to tip the scales all the way to the bearish side of things?
It depends who you ask. We'll explain exactly what we mean in a moment. First, let's run down last week's economic numbers, and preview this week's biggies.
Economic Calendar
Truth be told, there wasn't a lot in the way of economic data last week, and little of what we did get was meaningful. There are a couple of items worth discussing though.
One of them is November's retail sales. While Black Friday weekend was allegedly disappointing, it looks like spending before and after that period was strong enough to offset that shopping lull. Retail sales were up 0.7%, topping estimates of 0.6% growth, and even taking automobile sales out of the equations, retail spending was higher by 0.4% versus expectations of a 0.3% improvement. That shot in the arm Thursday couldn't have come at a better time... right after Wednesday's drubbing.
The only other data point worth a closer look was last month's producer price inflation. Though it's not as important as this week's consumer inflation rate will be, it's something of an omen, and it's a little discouraging. The annualized producer price inflation rate now stands at 0.7%, and was down 0.1% on a month-to-month basis for November. Even on a core basis, the 0.1% increase was weak.
But isn't tamed inflation a good thing? Tamed is one thing, but we're teetering on the edge of anemic inflation, and that's not necessarily a good sign. It suggests that suppliers are seriously lacking pricing power, which is ultimately a sign of flailing demand.
This week's consumer inflation data (coming Tuesday) will provide some more clarity on the inflation front, but it looks like we may be limping to the point of deflation.
Economic Calendar
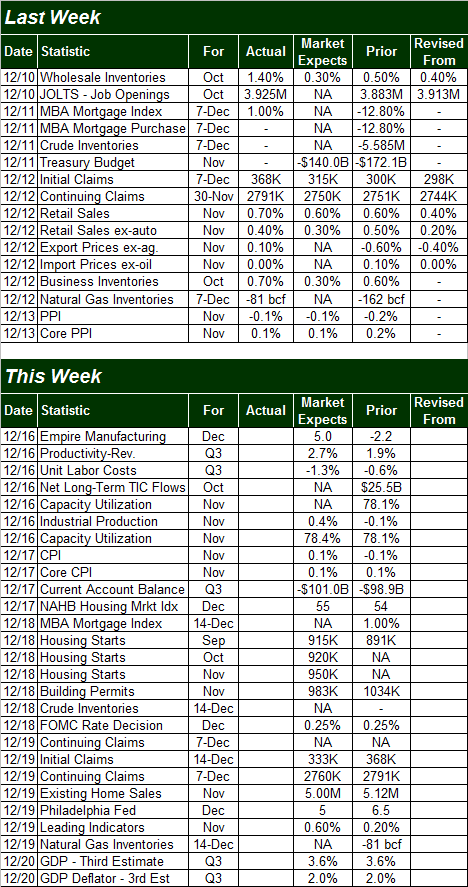
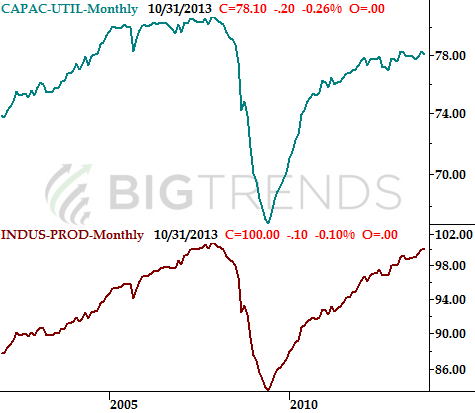
Although we're getting the next round of inflation data on Tuesday, the fireworks start on Monday with last month's capacity utilization and industrial productivity rates. Both should be up a bit. As long as they are, that'll be a plus for the market.
Capacity Utilization, Industrial Productivity Chart
On Tuesday we'll only be getting consumer inflation data. As of October, the annualized inflation rate was 0.96%. That's on the weak side, but even worse, marks the third straight month that inflation has fallen. We're moving towards deflation, but even if the inflation rate stabilizes here, it's still too low.
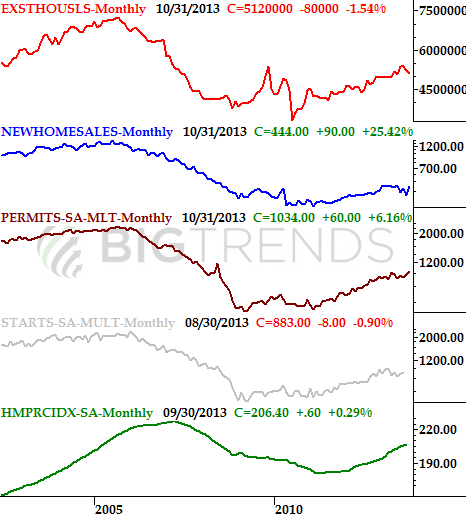
On Wednesday we're getting a huge dose of real estate data... three months' worth of housing starts numbers, as well as last month's building permits figure. All should be strong. The party doesn't end there, however. On Thursday we'll hear last month's existing home sales. It's projected to fall a little, but like starts and permits, the likely pace of 5.0 million for existing home sales is still a respectable figure.
Real Estate, Construction Chart
Finally, on Friday we'll get the third and final guess regarding third quarter's GDP. It's unlikely to change from the 2nd estimate of 3.6% growth.
Stock Market Index Analysis
We're going to start things this week with a look at the weekly chart of the S&P 500 (SPX) (SPY), as we need to put things in perspective before we dive into the details of the daily chart.
As was noted above, the bulls did a good job at not letting the sellers follow-through after Wednesday's implosion. On the other hand, by that time the damage had been done. The S&P 500 closed at 1775.32 last week, down 29.77 points (-1.6%). It was the worst weekly loss since late August, though it's worth noting that late-August dip was also a capitulation that sparked the 11.0% runup in the meantime. This time, however, the market's still too overbought to expect the same result as the last time we took this big of a hit. Take a look.
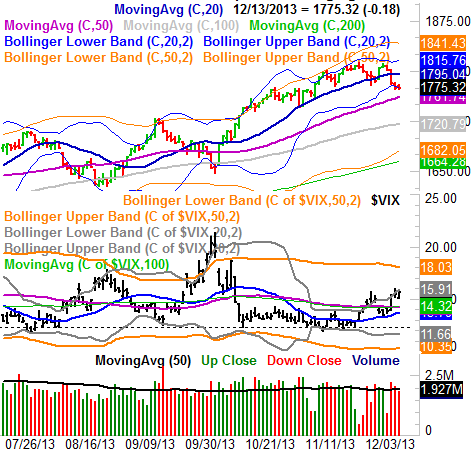
S&P 500 & VIX - Weekly Chart
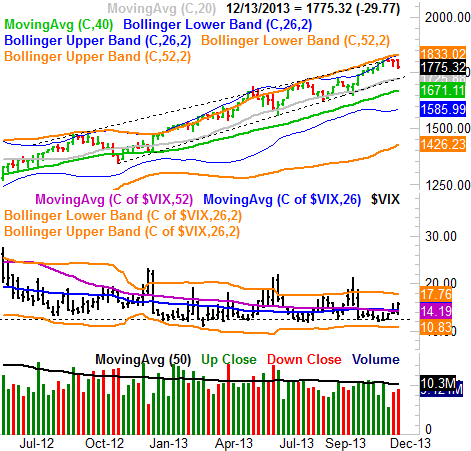
What's worth noting here - in the weekly timeframe anyway - is that there's no support line in place to stop the downtrend from unfurling a little more. The weekly chart's most likely floor is around the 1725-ish area, where the 100-day line has converged with a long-term straight-line support level (dashed). It's also on the weekly chart we can see the CBOE Volatility Index (VIX) (VXX) is trying to start a strong uptrend of its own... which is bearish for the market. That effort had been pretty anemic up until last week, but now we're seeing the heat turned up a little bit on the VIX. Like the S&P 500 has room to keep falling until a key floor is hit, the VIX has room to keep rising before it hits a key ceiling. What the bears want/need, however, is for the VIX to break above the upper band at 17.76 and the S&P 500 to break under the support at 1725 for any major correction to start materializing. Anything less, and we can only call it a little volatility.
Thing is, when we zoom into a daily chart of the S&P 500, we can see that (and we can see why) the bulls are putting up a fight. The SPX's lower 20-day Bollinger band was the rally point for the buyers, as it often is. Had the selloff just blasted through it, it would be a bearish clue. To see a pause there though? It's a sign there are at least a few bulls willing to put up a fight here. You can also see the VIX is balking a little now that it's testing its upper 20-day Bollinger band.
S&P 500 & VIX - Daily Chart
The bottom line is, while the undertow may be bearish, there's a chance the bulls could quell the effort before things reach the point of no return. It's a small chance, mind you, but a chance all the same.
This week is going to be a pivotal week. If the bulls don't do something highly convincing - like carry the S&P 500 back above the 20-day moving average line at 1795 - it's going to make it a lot easier to justify a year-end pullback... though it'll still be on the bubble. If the S&P 500 can't even make it back above its lower Bollinger band at 1775, however, that's going to be an even more bearish clue. And if the S&P 500 happens to tumble under the 50-day moving average line at 1761, that pretty much will push the market past the point of no return, and into a full-blown correction. If the 100-day line doesn't halt that pullback, then a revisit to the 1680 area is likely, where the 200-day average and the lower 50-day Bollinger band are waiting. That would be a 7.3% correction from the peak (which is still less than the normal size of a bull market correction).
First things first though. Let's see if the bulls are going to try and do anything impressive this week. We are, after all, headed into what is statistically a very bullish time of year.
Trade Well,
Price Headley
BigTrends.com
1-800-244-8736