Next Up, Earnings Season - Weekly Market Outlook
Next Up, Earnings Season - Weekly Market Outlook
With the government shutdown in effect for the last four workdays of late week, the market really didn't go anywhere - most investors seem content to watch it all play out from the sidelines. No real surprises there.
The hesitation is understandable, but the shutdown isn't going to last forever. Once the fog of the budget debate and the debt-ceiling showdown is lifted, stocks will start to move again, and they're going to move largely based on how they position themselves during this lull. Indeed, with earnings season beginning next week, the market may begin to move even without the shutdown coming to a close.
We'll weigh the odds and make some predictions (as always) right after a quick look at some key economic stats.
Economic Calendar
Thanks to the government shutdown, we didn't get all the data that was scheduled for release. In fact, we got very little of any real consequence. What little we did get, however, was relatively encouraging.
As it turns out, payroll processing company ADP says 166,000 new jobs were created last month. That was a little shy of expectations, and a little better than the prior month's tally. It's still not a great number, but there's a lot to be said for consistency ... no matter how tepid it is. The Department of Labor didn't get to confirm ADP's basic job-creation strength, as the DOL is one of the shutdown's victims. We did see the initial unemployment claims figure roll in at 308,000, which is the second decent week in a row on that front.
Everything else is on the grid.
Economic Calendar
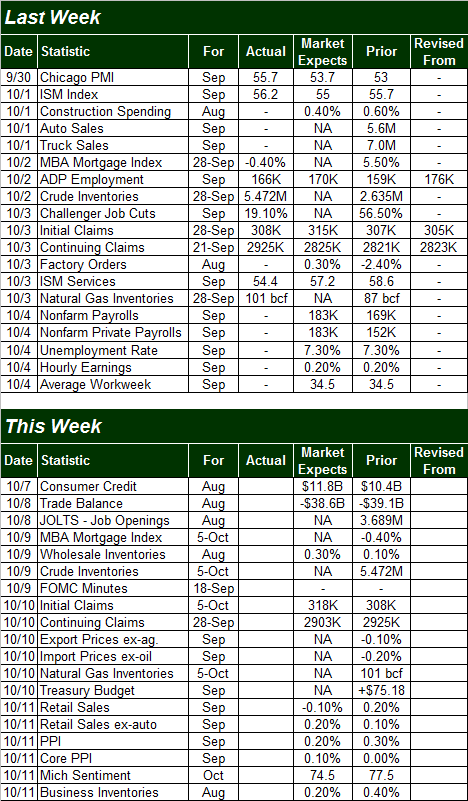
Note that for the same reason we didn't hear September's employment data on Friday, we may not get all of this week's data as scheduled. We'll go ahead and assume everything is going to be released as scheduled, just to keep tabs on the bigger picture. But, don't be shocked if the numbers don't actually come out. (Also keep in mind that most of the backed-up government data will be unleashed largely all at once if and when the government shutdown ends.)
With that in mind, note that we won't be getting much of anything worth worrying about until Friday when we get last month's retail sales, and September's producer price inflation rate.
Economists are only looking for a 0.2% increase in retail spending without cars, and sales should actually slump 0.1% when counting auto sales. That's tepid, and should we come up short, that could be a significant problem... maybe even the catalyst for a pullback.
Friday's producer price inflation rate should also show tepid growth, though not so much that we start creeping into alarming deflation territory. It should also be something of an omen of what to expect with the following week's consumer inflation rate.
Stock Market Index Analysis
As evidence of just how mentally on-hold traders are in the shadow of the government shutdown, the S&P 500 (SPX) (SPY) only lost 1.25 points (0.007%) last week, closing at 1690.5. Make no mistake though - what's happening and NOT happening now will all factor in once trading resumes... presumably when the stalemate in Washington ends, but possibly even before that. After all, earnings season is about to start.
The market's confines are the proverbial "usual suspects too - the S&P 500's 20-day moving average line (blue) at 1694.9 is the ceiling, and the 50-day moving average line (purple) at 1679.84 is the floor. As you can see, about 90% of last week's trading happened on between those two key lines.
S&P 500 & VIX - Daily Chart
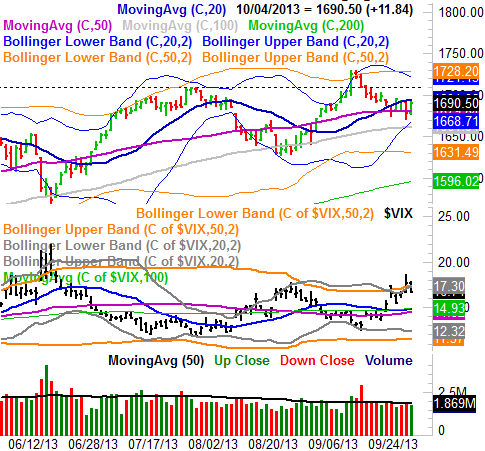
Yes, the CBOE Volatility Index (VIX) (VXX) made a sharp retreat on Friday after a two-week rise and a bump into both of its key upper Bollinger bands. And, there's room for the VIX to keep moving lower. That's technically bullish for stocks. There's little to suggest the market itself is ready to follow-through on that effort though, especially as long as the government shutdown remains in effect.
When you zoom out to a weekly chart, things start to look a little less compelling ... yet also more compelling.
The upside to the weekly chart is the way the 100-day moving average line (gray) as well as a long-term support line (dashed) that extends all the way back to November of last year. It looks the bulls have mentally drawn a line in the sand around there even before either line actually had to be tested.
SPX & VIX - Weekly Chart
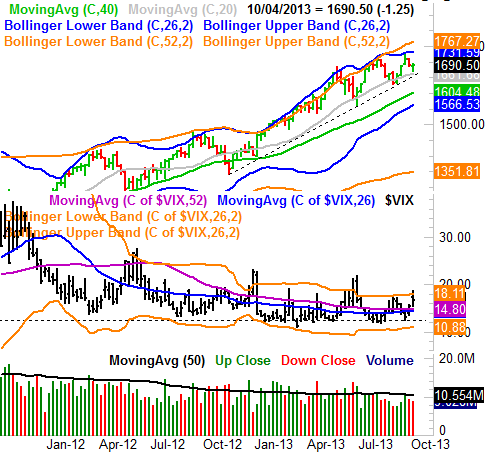
The bearish argument that's becoming more convincing on the weekly chart is, ironically enough, the VIX again. Although it was pointed sharply lower on Friday, we can see the larger undertow is still pointing it in an upward direction. That's bearish for stocks.
The counter-argument to the bearishness of a rising VIX is that we've seen surges - pointed peaks - like this from the VIX before .... three times in the last couple of years alone, and none of them broke the market's bigger uptrend. Things really are different this time around, however. The VIX has stopped making lower lows, and as we pointed out last week, we're getting closer to seeing the VIX's 26-week line (blue) move above the 52-week moving average line (purple). That would be a monumental change in the VIX's bigger direction, even if it went unnoticed. The confluence of support around 1662 would still need to buckle for the market's tide to officially turn bearish, but we're closer to that than it might seem, and the number of escape routes (away from a more significant correction) for the bulls is shrinking.
The bottom line is, the market is very much on the fence here, and making a big bet on a move in either direction may be ill-advised. This is very a much a "wait and see" situation. Fortunately, with the ceilings moving lower and the floors moving higher [the S&P 500's Bollinger bands on the daily chart are squeezing in sharply], we're not going to have to wait very long for a more significant move. Check back next week - we may have started that move by then.
Earnings Calendar
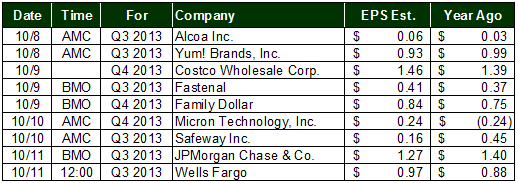
Yes, it's here. Third quarter earnings season is here. The official kickoff is Tuesday, with Alcoa's (AA) announcement. But, there are several other key announcements due this week. We'll give you each week's schedule in future Weekly Market Outlooks all the way through to the very end.
Also, for what it's worth, the "pros" say the S&P 500 should earn $26.84 for the third quarter. That's well below the estimate of $30.27 the experts were expecting for Q3-2013 way back in March of 2012; it's been steadily ratcheted down every quarter since then. The upside to that lowered estimate is, it was designed to be an easy "beat" (in the aggregate).
As is stands right now, the S&P 500 is valued at a trailing P/E of 17.0, and a forward-looking P/E of 14.65. That's a tad higher than average on the trailing, and a tad lower than average on the projected. Point being, we don't see any extreme valuation problems or opportunities.
Trade Well,
Price Headley
BigTrends.com
1-800-244-8736