Long-Term VIX Trendlines Sloping Higher - Weekly Market Outlook
Long-Term VIX Trendlines Sloping Higher - Weekly Market Outlook
Well, it was a good run. The market logged three consecutive weeks of gains before last week, when it took a small loss. O n the other hand, while the loss may have been small in terms of distance traveled, it may have been big in the sense that it came at a point when the market was vulnerable.
Could it just be a pause in front of a major decision from the government regarding the nation's 2014 budget? Yes, it could, but that doesn't mean that's the only thing going on here; stocks could have just as easily been ready to roll back regardless of what's going on in Washington. We'll go ahead and do our usual technical analysis, but take it all with a grain of salt ... the media is in charge of the market at this point, and that rhetoric can stop and turn on a dime.
We'll poke and prod the market in a second. First, let's take a bird's eye look at things via the important recent economic numbers.
Economic Calendar
Although all the noise of the debt-ceiling debacle - and some more noise from taper/no-taper debate - overshadowed it, there was actually quite a bit of economic news last week that will impact the long-term market.
Take Tuesday's home-price information for instance. The Case-Shiller Index (for July) said home prices were 12.4% higher than they were a year ago. And, the FHFA said the average price for a sold home grew 1.0% between June and July, or 8.0% on a year-over-year basis. Just note that this is data for July, and as such is already a little dated. But, in both cases, the near-term numbers extend what's become a long-term uptrend.
Home Prices Chart
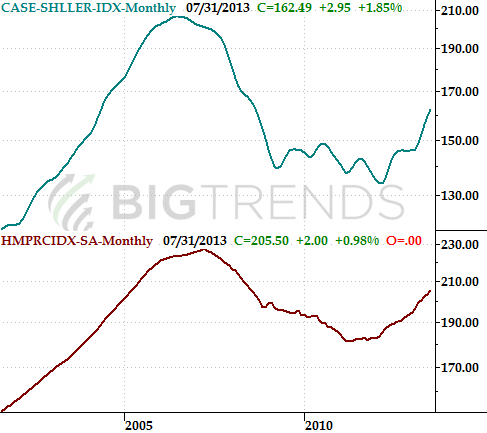
The real estate hits kept coming, with the rate of new home sales reaching a surprisingly strong pace of 421,000 for August; the pros were only looking for 415,000, up from 390,000 in July. That's actually NOT the best pace we've seen in years - the figure was better than 440,000 in the first half of the year. But, last month's upswing quells what started to look like a downtrend.
It wasn't all good news, however. Durable goods orders (with or without transportation orders) were pretty weak in August. They grew 0.1% overall, but fell 0.1% when taking planes, trains, and automobiles out of the equation. Pending home sales also fell, to the tune of 1.6%.
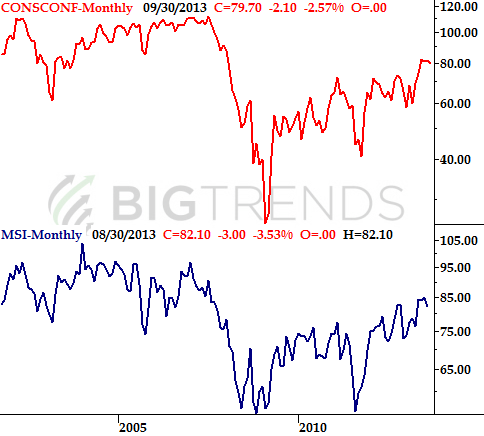
Perhaps most alarming of all, however, is the fact that consumer sentiment fell on two fronts... the Michigan Sentiment Index and the Conference Board's consumer confidence score. The former fell from 82.1 to 77.5, while the latter slipped from 81.8 in August to 79.7 this time around. Neither dip has reached game-changing proportions yet, and the Conference Board's consumer confidence index has plenty of wiggle room left. But, all big trends start as small ones.
Consumer Sentiment Chart
Everything else is on the following grid:
Economic Calendar
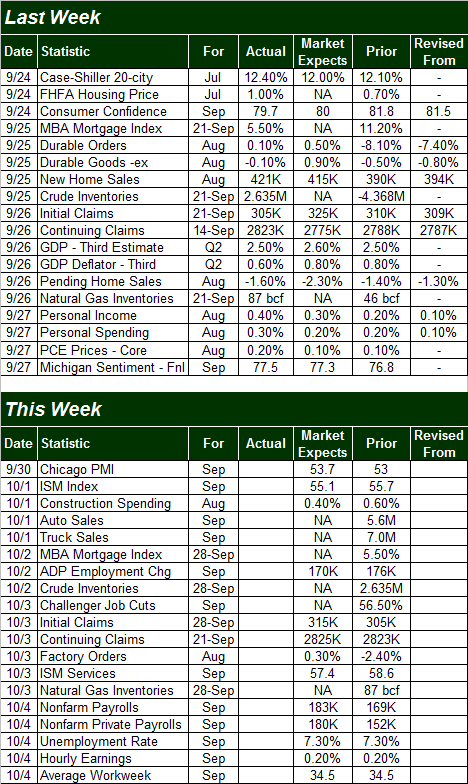
This week looks just as busy in terms of the number of economic data sets we'll see updated, but not too many of them are what could be considered major market movers. There is one area that's going to get the lion's share of refreshed data, however, and it's a biggie...an update on the employment picture.
Truth be told, economists aren't looking for much improvement on the jobs front. They're looking for payroll growth to be ramped up from 169,000 to 183,000 too, which is a significant bump, but bear in mind the data came up well short of expectations last time, and the prior month's numbers were revised sharply lower after the Department of Labor had a chance to recalculate the numbers. Point being, there are a lot of ways for Friday's announcement to go bad.
That being said, we'll get a preview of what to expect from the DOL on Friday with Thursday's ADP employment change figure. Forecasters say ADP will report job growth of 180,000 new payrolls, up from August's 176,000. Like the government's job growth numbers though, last month's ADP figures came up short of forecasts.
No matter what we get, the pros don't expect the unemployment rate of 7.3% to budge for September.
Stock Market Index Analysis
Let's start with a bigger picture, weekly chart of the S&P 500 (SPX) (SPY) this week, just for the right perspective.
We mentioned above how the timing of the pullback couldn't have been much worse (for the bulls). We say that specifically because the S&P 500 was right on the verge of punching through the upper 26-week Bollinger band - which would have been a biggie - two weeks ago. Instead, so far anyway, that upper band line appears to have proven itself as a ceiling... a ceiling that's going to be tough to break above. One bad week does not make a downtrend, but this small rollover last week looks more than a little like the beginnings of the pullbacks from late May and early August.
S&P 500 & VIX - Weekly Chart
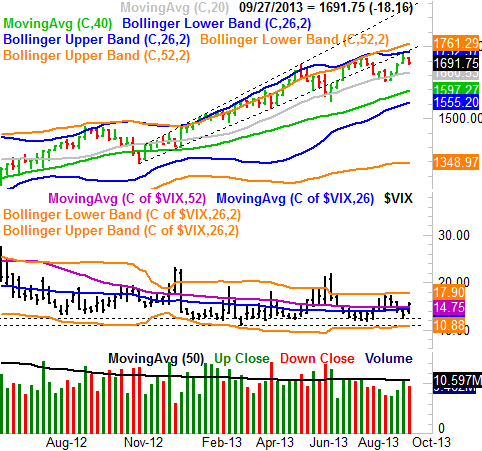
It's also on the weekly chart we can start to get a sense that the CBOE Volatility Index (VIX) (VXX) is working to start a bigger uptrend, which could prove to be a longer-term drag on stocks.
No, the VIX doesn't look like it's doing anything except bouncing around in a sideways range with just a quick glance. Take a longer, closer look at it though. We're starting to spend more time above its key moving average lines than below them, and it's starting to become easier for the VIX to move higher than lower.
As specific evidence that the VIX is rising in a major way, however, note that its 26-week moving average line (blue) is now sloped upward for the first time since January of 2012, and the 52-week moving average (purple) is moving sideways rather than downward for the first time since July of last year.
It actually makes sense... the market hasn't suffered ANY significant corrections since late 2011, meaning the VIX shouldn't have been broadly rising that whole time.
So what does this mean for us now? Well, considering we're overdue for a normal bull market correction anyway, the fact that the VIX is working on this kind of bigger-picture upswing may be an early warning of a bearish move - a more significant one than we've seen in a long time. It's not a bull-market-killer, mind you, but nothing that will be any fun for the buy-and-hold crowd to simply ride out.
What other clues pop up when we zoom into a daily chart? The reason for the pullback makes sense here too - the S&P 500 bumped into its near-term upper Bollinger bands a week and a half ago, and like clockwork, peeled back.
S&P 500 & VIX - Daily Chart
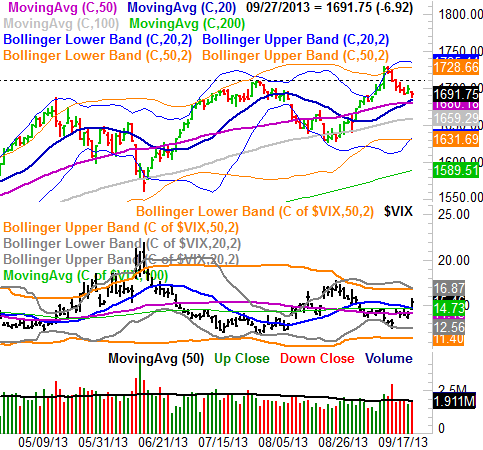
There's a flipside on the daily chart, however - the S&P 500 is still holding up above its 20-day and 50-day moving averages (blue and purple). In fact, it almost looks like the index started to push away from that line on Friday without even actually touching it. Until those lines are broken, any pullback talk is just theoretical.
Bottom line? The federal government's budget impasse may seem like it's keeping things on hold, and that may well be part of it. Even without the debt-ceiling debate going on, however, the market was already (mostly) trapped between a rock and a hard place. Until the floor around 1680 breaks or the ceiling around 1730 breaks, then all the loud-voiced predictions are nothing more than chatter. Maybe this will be the week.
Trade Well,
Price Headley,
BigTrends.com
1-800-244-8736