JOLTS, Production, Inflation, Housing - Weekly Market Outlook
JOLTS, Production, Inflation, Housing - Weekly Market Outlook
After a bullish six-week run, the weight of all the recent gains finally caught up with the market. Last week stocks logged a 1.0% dip, though to the bulls' credit, the bears had to work hard to make that happen. Trouble is, though it took a lot of effort, the week still ended with the tide moving in a bearish direction.
We'll explain how below, after digging into some of last week's and this week's economic numbers.
Economic Calendar
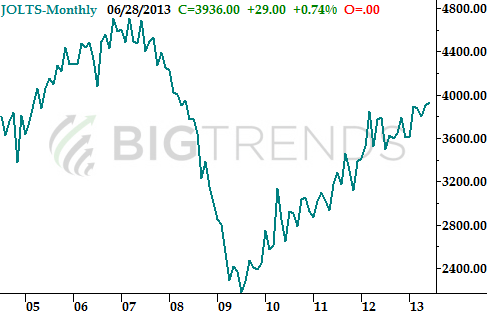
There wasn't a lot of economic data to work through last week, and not much of what we got was all that important. We did get a new data point put on our menu, though.... job openings. The JOLTS number (job openings and labor turnover survey) from the Bureau of Labor Statistics is going to be a new way we gauge the health of the employment market. For June, the JOLTS data indicates there were 3.936 million job openings, which is the highest number we've seen in years. That's encouraging, though doesn't explain why joblessness is so high; one can only presume that too many unemployed people aren't qualified or willing to take those jobs. We're looking forward to studying the JOLTS numbers as they progress in the future.
JOLTS Chart, as of June
 Speaking of jobs, note that the prior week's initial unemployment claims figure edged up a tad from the multi-year low of 328,000 claims the week before. Still, 333,000 new claims is a very low figure, and the 3.018 million ongoing claims is also near multi-year lows.
Everything else is on the following grid.
Economic Calendar
Speaking of jobs, note that the prior week's initial unemployment claims figure edged up a tad from the multi-year low of 328,000 claims the week before. Still, 333,000 new claims is a very low figure, and the 3.018 million ongoing claims is also near multi-year lows.
Everything else is on the following grid.
Economic Calendar
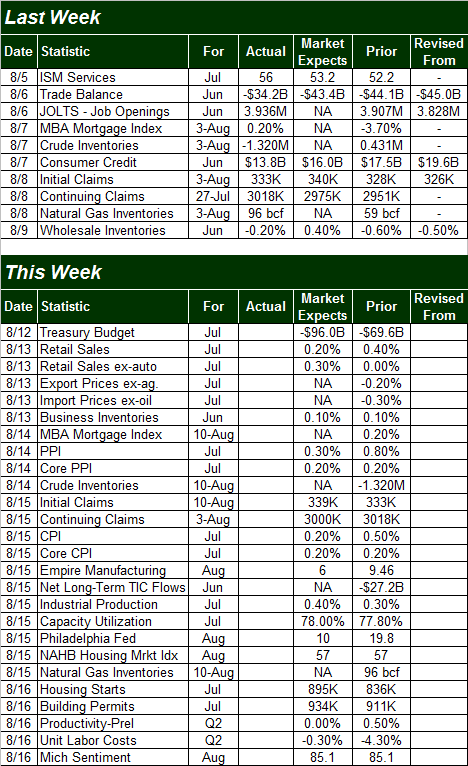 This week is clearly going to be much busier in terms of economic numbers. There's too much in the lineup to look at all of it. Let's stick with the highlights.
It's a big week ahead for inflation watchers. The producer price index, currently at an annualized growth rate of 2.5%, should roll in at around the same pace when July's PPI number is released on Wednesday. On Thursday we'll hear July's consumer inflation rate. It's currently rising at an annualized pace of 1.75%. That rate should hold through July as well. Though both figures have been modestly on the rise, neither has reached dangerous levels yet. Indeed, they're both on the lower end of the 'healthy' range.
If the Federal Reserve really does wrap up its QE efforts soon, that's apt to quell what little inflationary pressures we're seeing now.
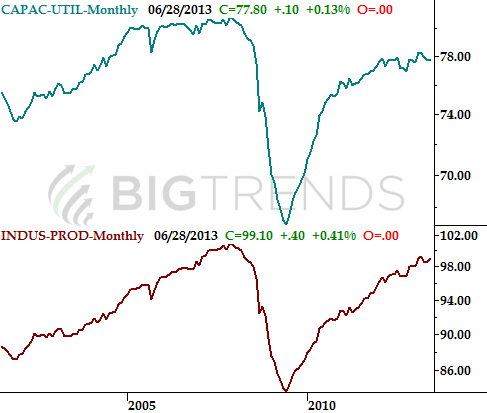
On Thursday we'll hear about July's capacity utilization and industrial productivity numbers. Both have been on the rise (albeit tepidly), which is bullish for stocks in our historical analysis, and economists are looking for more of the same tepid rate of improvement. Any strong deviation from the expected numbers could move the market, but anything close to the forecasted number - above or below - will likely be shrugged off.
Capacity Utilization and Industrial Productivity Chart, as of June
This week is clearly going to be much busier in terms of economic numbers. There's too much in the lineup to look at all of it. Let's stick with the highlights.
It's a big week ahead for inflation watchers. The producer price index, currently at an annualized growth rate of 2.5%, should roll in at around the same pace when July's PPI number is released on Wednesday. On Thursday we'll hear July's consumer inflation rate. It's currently rising at an annualized pace of 1.75%. That rate should hold through July as well. Though both figures have been modestly on the rise, neither has reached dangerous levels yet. Indeed, they're both on the lower end of the 'healthy' range.
If the Federal Reserve really does wrap up its QE efforts soon, that's apt to quell what little inflationary pressures we're seeing now.
On Thursday we'll hear about July's capacity utilization and industrial productivity numbers. Both have been on the rise (albeit tepidly), which is bullish for stocks in our historical analysis, and economists are looking for more of the same tepid rate of improvement. Any strong deviation from the expected numbers could move the market, but anything close to the forecasted number - above or below - will likely be shrugged off.
Capacity Utilization and Industrial Productivity Chart, as of June
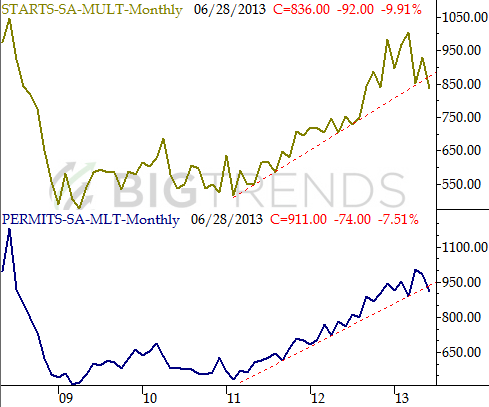
 Finally, we kick off a two-week wave of housing data on Friday, with July's housing starts and building permits. You might recall that both have been falling of late, and reached the verge of starting a dire downtrend. Forecasters expect a slight improvement for last month. If for some reason either or both instead roll in lower, that's trouble. It'll be tough to say the housing market is doing anything besides contracting then, as starts will have been falling since March, and permits will have been on the slide since April (and both will have broken under key trend/support lines)
Housing Starts and Permits Chart, as of June
Finally, we kick off a two-week wave of housing data on Friday, with July's housing starts and building permits. You might recall that both have been falling of late, and reached the verge of starting a dire downtrend. Forecasters expect a slight improvement for last month. If for some reason either or both instead roll in lower, that's trouble. It'll be tough to say the housing market is doing anything besides contracting then, as starts will have been falling since March, and permits will have been on the slide since April (and both will have broken under key trend/support lines)
Housing Starts and Permits Chart, as of June
 Stock Market
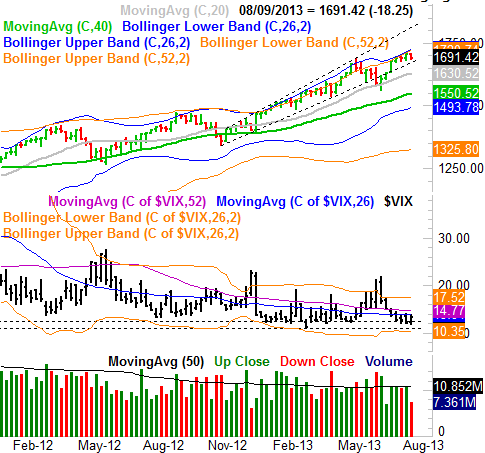
Like last week, we want to start this week with a weekly chart of the S&P 500 (SPX) (SPY, just to put things in perspective before getting into the details.
There are two things to note on the weekly chart below. One of them is the fact that the S&P 500 seems to now be losing its five-week war with its key upper Bollinger bands. The other is the fact that the CBOE Volatility Index (VIX) (VXX) seems to have found a floor at 12.4. Though it's still too soon to day the SPX has kick-started a correction, it's with distance of breaking under the long-term support line (dashed) at 1680. If the S&P 500 should fall under 1680 this week and/or the VIX finally moves above its 52-week average at 14.77, that should pretty much put the overdue pullback into motion.
S&P 500 & VIX - Weekly Chart
Stock Market
Like last week, we want to start this week with a weekly chart of the S&P 500 (SPX) (SPY, just to put things in perspective before getting into the details.
There are two things to note on the weekly chart below. One of them is the fact that the S&P 500 seems to now be losing its five-week war with its key upper Bollinger bands. The other is the fact that the CBOE Volatility Index (VIX) (VXX) seems to have found a floor at 12.4. Though it's still too soon to day the SPX has kick-started a correction, it's with distance of breaking under the long-term support line (dashed) at 1680. If the S&P 500 should fall under 1680 this week and/or the VIX finally moves above its 52-week average at 14.77, that should pretty much put the overdue pullback into motion.
S&P 500 & VIX - Weekly Chart
 When we zoom into a daily chart, it becomes clear a major line in the sand has been established at 1688 (dashed). That was the peak level from May, a level where the bulls and the bears tussled in July, and the floor for the prior three trading days. The bulls are holding the line there, but it's getting tougher and tougher to do.
SPX and VIX - Daily Chart
When we zoom into a daily chart, it becomes clear a major line in the sand has been established at 1688 (dashed). That was the peak level from May, a level where the bulls and the bears tussled in July, and the floor for the prior three trading days. The bulls are holding the line there, but it's getting tougher and tougher to do.
SPX and VIX - Daily Chart
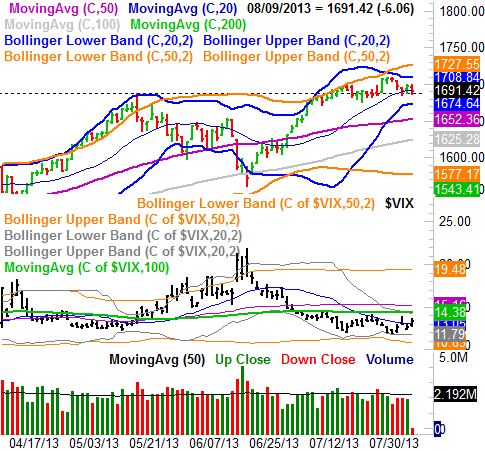 If you look closely, however, you'll see the S&P 500 has finally closed under its 20-day moving average line (thin, blue). That could be a relatively big deal, though given how erratic the market has been of late, we may want to wait for some concrete clues that the tide has turned bearish. One or two more lower closes may do the trick, especially if the VIX makes its way past several converged moving average lines between 14.40 and 15.4.
For what it's worth, while it may not be clear if stocks are gearing up for a bullish move of bearish move [we're leaning bearishly], one thing is clear - we're gearing up for a good-sized move. Periods of low volatility are followed by periods of high volatility, and vice versa. The fact that the 20-day Bollinger bands are squeezing in on the index more than they have in months indicates the low-volatility consolidation phase. Whatever happens from here should happen with a lot of speed and strength. Be alert for that initial push outside of the Bollinger band envelope. That will be an early warning, especially if it's a downside move.
Trade Well,
Price Headley
BigTrends.com
1-800-244-8736
If you look closely, however, you'll see the S&P 500 has finally closed under its 20-day moving average line (thin, blue). That could be a relatively big deal, though given how erratic the market has been of late, we may want to wait for some concrete clues that the tide has turned bearish. One or two more lower closes may do the trick, especially if the VIX makes its way past several converged moving average lines between 14.40 and 15.4.
For what it's worth, while it may not be clear if stocks are gearing up for a bullish move of bearish move [we're leaning bearishly], one thing is clear - we're gearing up for a good-sized move. Periods of low volatility are followed by periods of high volatility, and vice versa. The fact that the 20-day Bollinger bands are squeezing in on the index more than they have in months indicates the low-volatility consolidation phase. Whatever happens from here should happen with a lot of speed and strength. Be alert for that initial push outside of the Bollinger band envelope. That will be an early warning, especially if it's a downside move.
Trade Well,
Price Headley
BigTrends.com
1-800-244-8736