Hot January Looms, But Watch Valuations - Weekly Market Outlook
Hot January Looms, But Watch Valuations - Weekly Market Outlook
It may have taken a couple of days to get up to speed, and it even took an extra nudge to get it over the hump. But, the S&P 500 (SPX) (SPY) finally did it. The market finally punched through a key resistance level last week, getting into position thanks to Wednesday's encouraging words from Ben Bernanke regarding the economy (and the decision to begin tapering), and then finally getting past the hurdle on Friday, fueled by the second upward revision for Q3's GDP growth rate.
From a purely technical perspective, the market's back in bullish mode. Granted, there's more to handicapping the market than just getting a read on the most recent technicals... especially in this tense environment. Then again, the chart is an indication of the majority opinion right now. We have to assume the way things seem at this point is the way they are.
We'll look at those details in a second. The first thing we need to do is examine last week's economic numbers and figure out whether or not what the Fed said on Wednesday was actually good news.
Economic Calendar
On the off chance you haven't heard, the Federal Reserve is finally going to begin that long-awaited tapering process of its monthly stimulus efforts. Rather than injecting $85 billion in cash to the economy every month through the purchase of treasury bonds, that figure has been reduced to $75 billion per month until further notice. That "further notice" will most likely be the next measurable dose of economic progress... like lower unemployment, or another strong quarter of GDP growth. Boosting Bernanke's case for tapering is the Fed's expectation that the economy should grow right around a 3.0% clip next year. It's not a new forecast, but a confirmed one.
That got the ball rolling on Wednesday, yanking the market out of a quickly-accelerating pullback, and putting pressure on the market's recently-developed ceiling. That ceiling wasn't hurdled until Friday, however, when the Q3 GDP growth rate was finalized at a whopping 4.1%, up from the first revision to 3.6%, which was up from the initial estimate of 2.8%. That's huge, and more than enough motivation to push stocks to new all-time highs.
S&P 500 vs. GDP Growth Rate
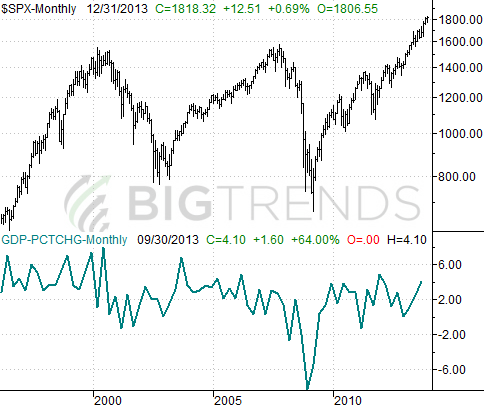
All that being said, Q3's GDP growth rate and the Federal Reserve finally feeling like the economy is on firm enough footing to begin tapering weren't the only economic data nuggets to come out last week. We also got a heavy dose of real estate data, although it wasn't wholly great. Housing starts were up to a pace of 1.091 million, but issued permits fell from 1.039 million in October to 1.007 million for November. Existing home sales fell from a pace of 5.12 million to only 4.9 million. None of those numbers are "bad" per se, but they suggest the real estate market's strength isn't quite as reliable as it was just a few months ago.
Everything else is on the following grid:
Economic Calendar
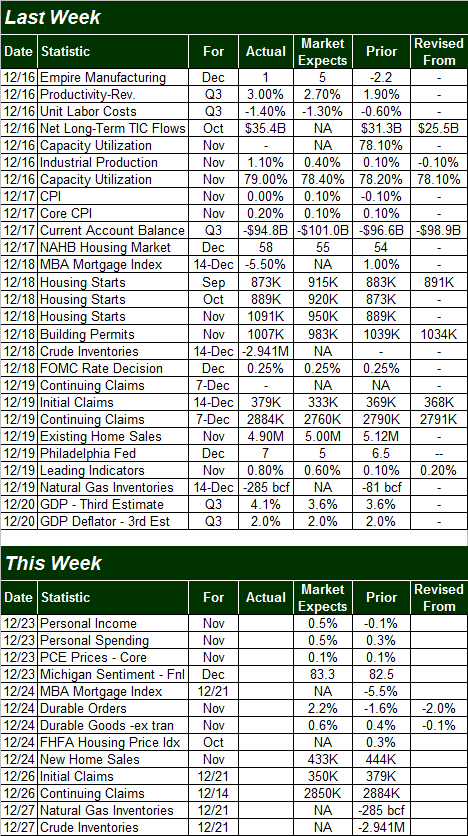
The coming week isn't going to be nearly as busy, and very little of the data we're getting is all that important. In fact, the only item we're really interested in is Tuesday's new home sales. The pros say the pace should fell from October's 444,000 to 430,000 for November. It's still a decent number, but with traders already mentally bracing for a dip, and shortcoming could be a problem.
Durable orders for November will be out on Tuesday as well, and economists are looking for a 2.2% increase there. That's a lofty outlook, and could be a setup for a disappointment. Either way, most investors aren't going to care much by that point.
Stock Market Index Analysis
We'll start with a daily chart of the S&P 500 this week because, well, it tells the story about as well as it needs to be told. The S&P 500 broke above the technical ceiling at 1812 (dashed). It's simple, but important. Now that the bulls have cleared a major hurdle, it's going to be much easier to make smaller, consecutive gains. In other words, the rally looks like it's been renewed, which dovetails very nicely into the requisite Santa Claus rally phase, which could inspire the fairly-usual January bullishness. Take a look.
S&P 500 & VIX - Daily Chart
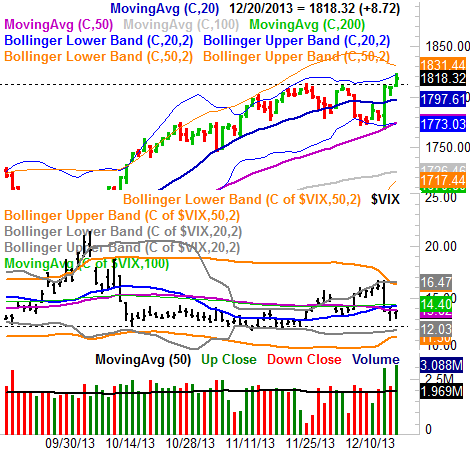
To be clear, we still don't expect the rally to proceed unchecked and unfettered. But, the heavy lifting has been done, and done in the right way. The S&P 500 actually pulled back a little on Wednesday to brush - then push off of - its 50-day moving average (purple) as well as its lower Bollinger band. And, both big surges last week unfurled on some of the highest-volume days we've seen in months. This breakout effort IS a majority opinion. The CBOE Volatility Index (VIX) (VXX) also backed off late last week after the Fed news (and ahead of the weekend and a coming Holiday shortened week), as would be expected.
There's no firm upside target we can point to right now, since we're (literally) in uncharted waters here at record highs. For what it's worth though, the average gain in January is 0.95%, and it's up about 60% of the time.
What's interesting, however, is that January has a tendency to be a very hot or very cold month. In only nine of the 25 Januarys that the S&P 500 has lost ground (since 1950) has the loss been less than 2.0%. In the other sixteen of those 25 Januarys, the market has lost more than 2.0%...and it's lost more than 3.0% in 13 of those past 25 losing Januarys.
The winners are just as intense. Of the 38 winning Januarys we've seen since 1950, only nine of them doled out gains of less than 2.0%. The other 29 of the winning Januarys drove gains of more than 2.0%. Seventeen of them saw gains of more than 4.0%.
Point being, if January is going to be a winner (as it seems like it's going to be) history and statistics say it's going to be a big one. Makes sense. Though they tend to change their mind several times over the course of the year, psychologically, investors are already coming to conclusions about what the market has in store for the coming year. They may also be apt to make the according moves early on in the year... which is probably why January is usually such an intensely hot or cold month.
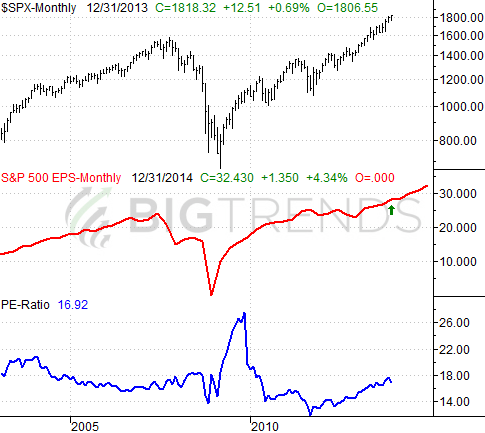
One thing to bear in mind as the rally progresses (if it progresses) - valuation. The trailing P/E for the S&P 500 now stands at 17.4. That's high. Even the projected (next twelve months) P/E of 15.4 isn't cheap, by long-term norms, and leaves no room for error. Just something to keep in mind if January ends up being a bullish one and drives the trailing P/E to the 18.5 area. Analysts are looking for per-share earnings to grow by 15.7% over the next four quarters (starting with Q4's numbers), which is exciting, but perhaps a little optimistic.
S&P 500, Earnings and Valuation
Trade Well,
Price Headley
BigTrends.com
1-800-244-8736