Eerily Perfectly Bullish - Weekly Market Outlook
Eerily Perfectly Bullish - Weekly Market Outlook
It may have been a modest effort, but modest was still good enough to carry the market to record highs last week. Even more interesting - and perhaps a little surprising - is that volume was growing on the way up. That suggests traders at least have a little faith in the budding rally.
The $64,000 question is, do we/you really believe the market is capable of rallying in late July and early August (historically a tepid time of year) after it's already advanced 6.3% in just four weeks? Stocks are already over-extended, and shouldn't be able to keep chugging at their recent pace. The answer: Never say never... especially during earnings season.
We'll put that answer under the microscope in a moment, after we paint the bigger picture with last week's and this week's economic numbers.
Economic Calendar
Though the market made progress last week, it did so in spite of a couple of economic snafus.
For starters, retail spending was tepid in June... up 0.4% with autos (versus expectations of a 0.7% increase), and flat when taking cars out of the equation (versus expectations of a 0.4% improvement). One month doesn't make a trend, but if consumers keep the purse strings drawn tight again for July, that's going to start taking a bigger economic toll.
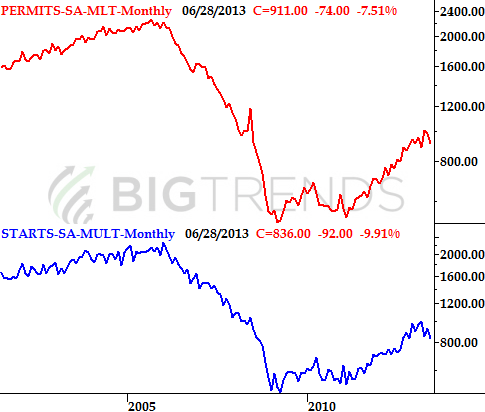
The other stumbling block for the economy last month was on the real estate front - housing starts and building permits were both down. Starts fell from a pace of 928,000 to 836,000, while issued permits fell from an annual pace of 985,000 to 911,000. Both dips could be considered the beginning of trend-changing moves. It's not like either are so far gone that the downtrend can't be stopped, but something's going to have to change soon.
There was some good news last week. The annualized inflation rate moved from May's reading of 1.36% to 1.75%, while capacity utilization as well as industrial productivity both ramped up.
New Construction Permits Issued, and Starts
 Yes, a little inflation can be a good thing. We were edging towards deflation as of April, with the inflation rate reaching as low as 1.06% from October's peak of 2.16%. That's good, as deflation can be just as disruptive to the economy as rampant inflation.
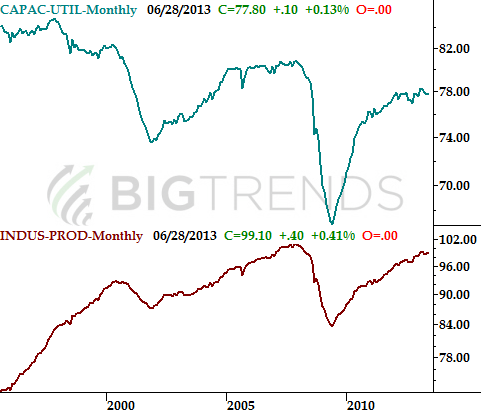
As for capacity utilization and industrial productivity, the former crept up from 77.7% to 77.8%, while the latter grew by 0.3%. Those aren't leaps and bound better, and certainly don't shake either piece of data out of their recent lulls. But, at least neither has slipped into full-blown downtrends yet.
Capacity Utilization and Industrial Productivity Index
 Everything else is on the following table.
Economic Calendar
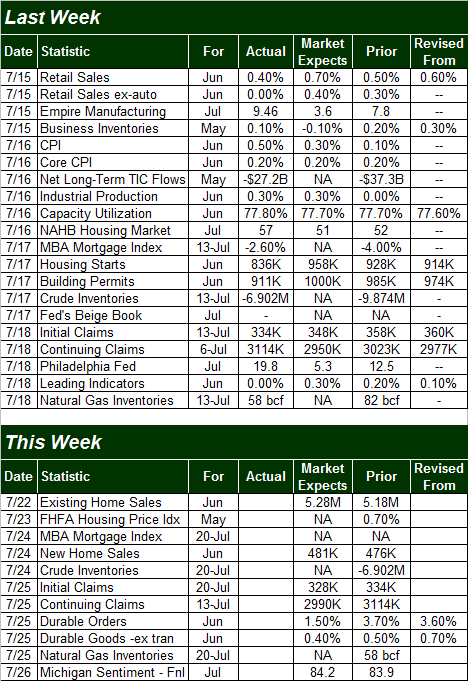 The coming week will be very light in terms of economic data, and the vast majority of the big announcements we'll be getting focus on housing. Monday's existing home sales rate is expected to reach 5.28 million, which would be the highest reading since November of 2009's 5.38 million. That was an anomaly though; the sustainable trend hasn't been stronger than 5.0 million since 2007.
We'll get the new-home sale rate on Wednesday. Economists are looking for a modest increase there too.
Stock Market Index Analysis
Just to preface any technical look at stocks, note that from an overarching perspective, everything looks bullish... almost oddly bullish. In fact, things look almost perfectly bullish, which is cause for concern. Most rallies materialize when stocks have a wall of worry to climb. Complacency and optimism are so strong now, that one has to wonder if this is an "expect it when you least expect it" situation. That being said...
Just for the sake of keeping things fresh - and because it's merited - we'll first focus on the weekly chart of the NASDAQ Composite (COMP) (QQQ) this week. It best illustrates the idea posed above that things have reached an extreme level of bullishness that we all too often tend to see at significant market tops.
Don't worry about the details... just take in the bigger picture. The NASDAQ is pressing into a long-term (though admittedly bullish) resistance line (dashed). The NASDAQ's Volatility Index (VXN) is near multi-year lows, having been in a downtrend - and guided by some key technical floors and ceilings - for most of that time. On the surface it seems bullish, but with some thought, it's clear the Composite is pushing its luck.
NASDAQ Composite - Weekly Chart
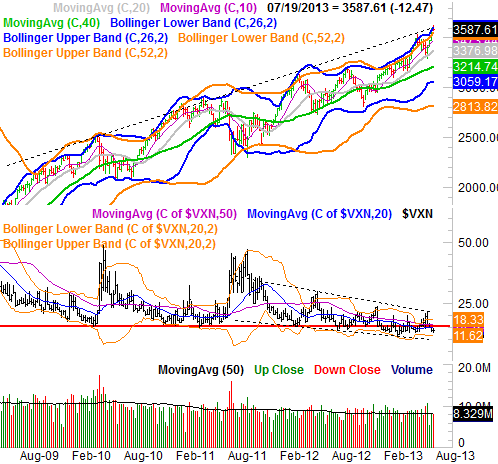 So what's next? It's possible the market could go parabolic.... well, more parabolic than it's already gone. If it does though, it's going to do something we've really not seen since the dot-com heyday of the late-90's. Maybe stocks are really worth a lot more than where they're trading now. But, given the so-so data we've been seeing this year, that's a tough premise to buy into (metaphorically, and literally). Just be alert for anything.
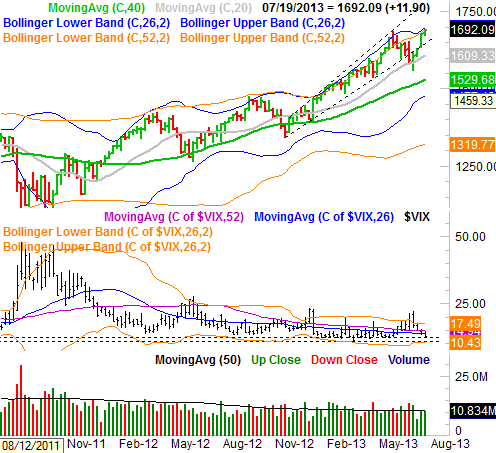
The S&P 500's (SPX) (SPY) weekly chart doesn't look quite as overextended, leaving the broad market a little room to keep rolling. Yes, the SPX is being forced to put up a fight at the upper Bollinger band lines around 1692. The index hasn't had much trouble pushing up an into those bands before, so it's possible it can still keep rallying here. You can also see that the CBOE Volatility Index (VIX) (VXX) has a little room to keep moving lower before hitting a major floor at 10.4. There's not a lot of room for the VIX to keep falling, but some.
S&P 500 & VIX - Weekly Chart
 Zooming in on a daily chart of the S&P 500, you can see how the index walked past the ceiling of its May peak at 1687.18. That's bullish, though it would be considerably more bullish if the index would set up a good technical base at or around (or above) the 1687 area. Until the market solidifies the recent move, it will still be vulnerable to a pullback... the downside of big, rapid rallies. Working in its favor is the fact that volume was still building as last week's rally pressed forward.
S&P 500 & VIX - Daily Chart
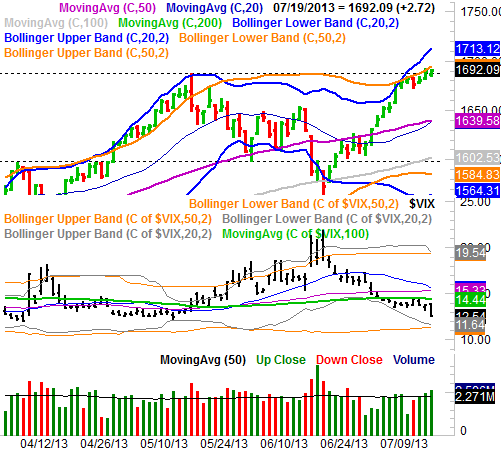 Bottom line? Like they say, the trend is your friend until it isn't. In that light, we have to be bullish here, if only because the market finished last week stepping into new-high territory. Just bear in mind that there's still a lot of vulnerability built in here, and stocks are going to have to bleed off some of this overbought condition sooner or later.
The good news is, if that bleed-off happens soon - as in this week - there's some pretty good support around 1640, where the 20-day and 50-day moving average lines have converged. Both have been support and resistance in the recent past, and should act as support in the future. Only time can tell when we'll put that floor to the test, however. This is most definitely still a day-to-day affair.
Trade Well,
Price Headley
BigTrends.com
1-800-244-8736

