Earnings Season Off To Shaky Start - Weekly Market Outlook
Earnings Season Off To Shaky Start - Weekly Market Outlook
The pessimism that was killing stocks early last week ended up being replaced by optimism on Thursday and Friday, fueled by progress on the budget debate going on in Washington D.C. Despite the strong end to the week, however, it's still too soon to get blindly bullish - most everything still depends on politics, which is still little more than a coin toss at this point. And, even if the two parties come to some sort of amicable agreement, there's no guarantee the market will continue rallying because of it; the upside of a federal budget decision may already be baked into the market's value thanks to the rally late last week.
We'll weigh the odds, set some targets, and draw a few lines in the sand in a moment. First, let's take the best look we can at last week's and this week's economic data.
Economic Calendar
With a government shutdown still in effect, once again we're not getting all the economic data we'd normally be hearing. We'll do the best we can with what we've got... which isn't much. In fact, all we got was the prior week's unemployment claims, and the first Michigan Sentiment Index score for October.
The initial claims figure jumped from 318,000 to 374,000 for the week ending on October 5th. That's a big rise, but bear in mind it may reflect claims made by some furloughed government employees or government-dependent workers. The ongoing claims number (from the week before, ending on September 28th) barely budged at all, coming in at 2.905 million versus 2.903 million for the previous week.
Incredibly enough, even with the economic and political mess that landed on our laps at the beginning of the month, the Michigan Sentiment Index came in at 75.2 for early October, just down a tad from September's final score of 77.5.
Economic Calendar
The coming week could be a very busy one, IF the shutdown ends ... which looks like will be the case. We'll just assume and act as if everything is going to proceed normally.
Wednesday: Will inflation remain tame? The pros are looking for no more than an average uptick in the CPI index (+0.1%, on a core as well as a non-core basis). The annualized inflation rate last rolled in at 1.56% for August, down from July's 1.96%. That's palatable, though deflation is once again a legitimate worry.
Thursday: Housing starts and building permits for September will be unveiled on Thursday. You might recall each had waned in the middle of the year, and neither has actually recovered in the meantime. One more bad month here could really spook investors.
Housing Starts and Building Permits
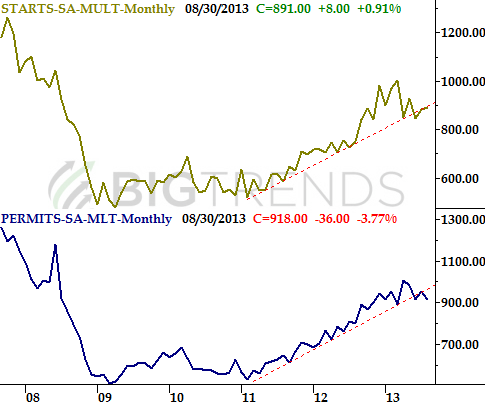
Thursday: We'll also get last month's capacity utilization and industrial production numbers on Thursday. Both have shown promise of late, though neither has been particularly impressive. These really could fall either way.
Capacity Utilization and Productivity Index
Just keep in mind that all the data that has been unreleased last week and the prior week will be unveiled - abruptly - should the government begin functioning again. That could really create a lot of havoc in a short period of time if-and-when it happens.
Stock Market Index Analysis
Over the course of the last two days of last week, it looked like the Democrats and the Republicans would be able to come to some sort of an agreement. That's the reason - and really the only reason - stocks were so bullish those two days. Then this weekend, it became clear the impasse is still solid as a rock. The end result? Realistically, by the time you're reading this the market could already be well on its way to giving up much of those gains.
Even then, betting on a big bearish move from here isn't a great idea ... clearly the market is ready to rally when (not if) the budget fiasco finally ends up getting resolved. Point being, don't dig in too deep on either side of the fence here, as the market's direction can - and probably will - stop and turn on a dime.
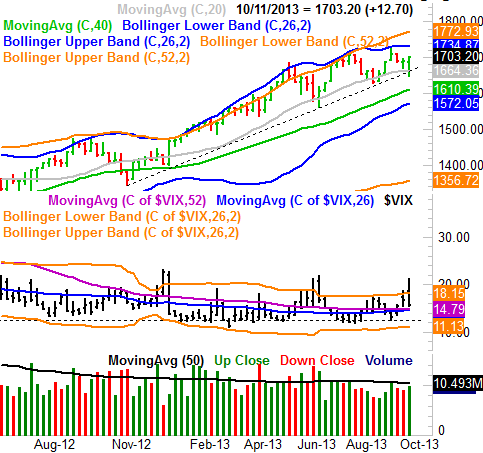
With that as the backdrop, the most meaningful assumption that can be made about the market right now is that even a politically-driven pullback will be halted, for the S&P 500 (SPX) (SPY), around 1660, where the lower 20-day Bollinger band as well as the 100-day moving average line are about to converge. That would roughly put the SPX back to where it started its upside reversal on Wednesday.
S&P 500 & VIX - Daily Chart
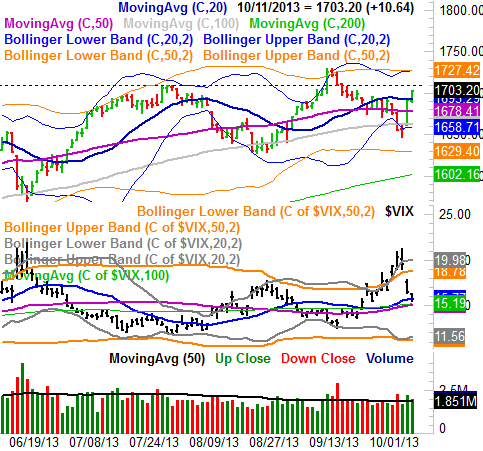
You can also see the CBOE Volatility Index (VIX) (VXX) plunged the last couple of trading days, leaving behind a big gap on Thursday that's begging to be closed. That's going to help apply some bearish pressure come Monday.
The thing is, unless the S&P 500 breaks under - and stays under - the 1660 mark, then a pullback is nothing more than just a little volatility.
As you can see on the weekly chart, that level isn't just where the 100-day moving average line is. That level is also where a major, long-term support line (dashed) that extends back to last November currently rests. That support level has been tested four times since then, and all four times the bulls held the line there. Regardless of what's going on in Washington D.C., until the 1660 area really breaks down on a permanent basis, the bulls don't have much to worry about.
SPX & VIX - Weekly Chart
That being said, it's not like the bulls have a lot to celebrate here either. The upper 26-week Bollinger band (which has been a historical ceiling for months now) has flattened out over the last few weeks. The less-upward-sloped the upper band line is, the more apt it is to push the index lower when it's tested, as opposed to just guiding the S&P 500 higher like it did between February and May of last year. Until/unless the S&P 500 can make its way above the upper band line at 1735 - which would also mean the SPX is hitting new all-time highs - we can only assume any bullishness is just volatility.
Again, this is a situation where the right thing to do is hang back and let the chips fall before committing to anything. More than anything right now, the market is just stuck between a rock and a hard place.
Earnings
Not really the best start for earnings season. Though only 27 of the S&P 500's have reported so far, seven of them - about 25% - have fallen short (versus the norm of between 10% and 20%), and less than half have managed to top estimates (versus the norm of about 65%). It's still a small sample size, so don't jump to conclusions just yet. But, it's a rough start. Here's what's in store this week.
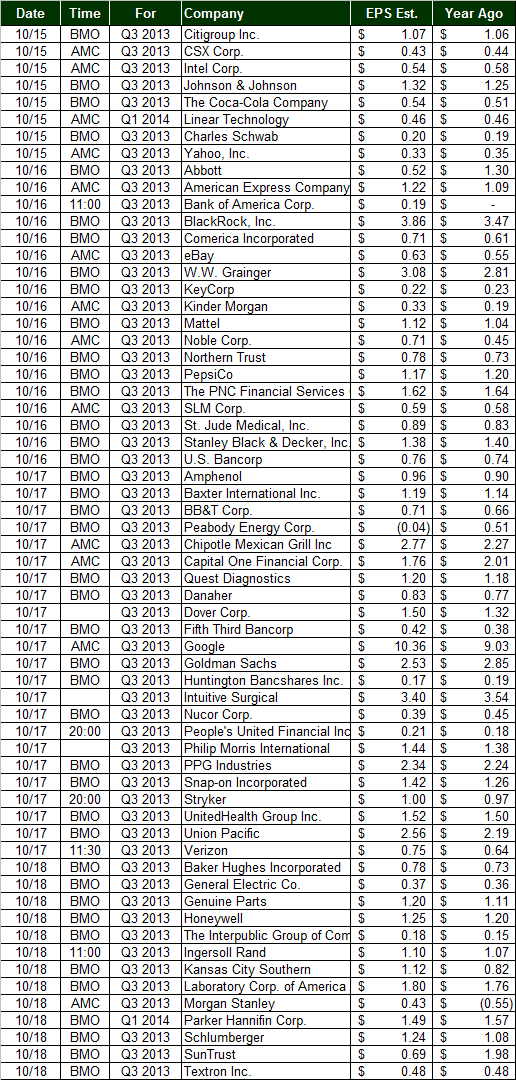
Earnings Calendar
Trade Well,
Price Headley
BigTrends.com
1-800-244-8736