Conflicting Signals - Weekly Market Outlook
Conflicting Signals - Weekly Market Outlook
Kudos to the bulls. At the beginning of last week it looked like the bears were finally going to push the market past the point of no return. By Thursday of last week though, it became clear the market wasn't ready to give in just yet.
That late-in-the-week save doesn't inherently mean the market has completely side-stepped a serious correction, however. But, it certainly ups the odds of doing so.
We'll look at the likelihood of a continuation of last week's bullishness in a moment. First (and as always) we want to paint the bigger picture using the broad brush strokes of the economy's numbers.
Economic Calendar
There may not have been a lot of economic data to soft through last week, but what little we got was fairly important, particularly on the housing front.... though the real estate data we got painted quite a mixed picture.
The good news is, existing home sales soared to an annual pace of 5.39 million in July. That's the best pace in years. The bad news, the pace of new home sales slumped to only 394,000 last month. That's the slowest pace in several months.
Existing Home Sales, New Home Sales
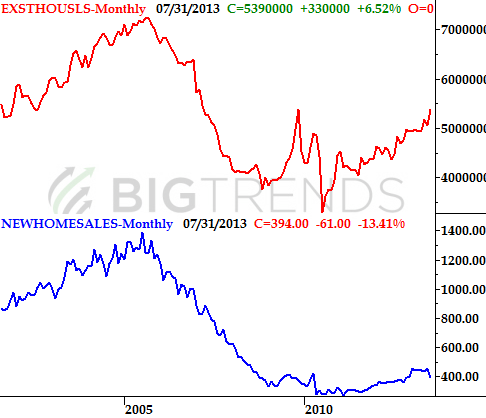 Mixed message? You bet
As for a plausible reason why existing home sales perked up while new home sales stumble, generally speaking, on a square-footage basis, new houses tend to cost more. That's an admittedly-strained theory, however, yet still the best one available. We'll need to wait for clarity on the matter, which will only come when we get August's data in late September.
Economic Calendar
Mixed message? You bet
As for a plausible reason why existing home sales perked up while new home sales stumble, generally speaking, on a square-footage basis, new houses tend to cost more. That's an admittedly-strained theory, however, yet still the best one available. We'll need to wait for clarity on the matter, which will only come when we get August's data in late September.
Economic Calendar
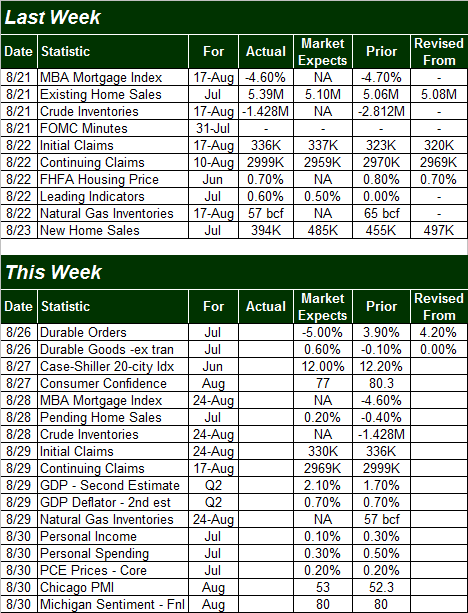 This week there's more data in the lineup, but not much of it that really matters.
We'll get durable orders numbers fir July on Monday. The pros are looking for a 0.6% increase when taking planes, trains, and automobiles out of the equation. Problem is, transportation makes up a huge part of the economy. The slump in that industry is expected to drive a 5.0% dip in overall durable orders for July. The market will react to that figure.
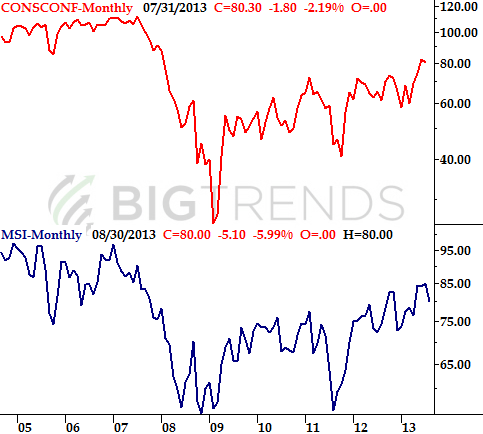
It's also going to be a big week for confidence measures. The Conference Board's consumer confidence score comes out on Tuesday, and the second (of three) Michigan Sentiment Index readings will be out on Friday. The former is expected to slump from 80.3 to 77.0 this time around, while the Michigan Sentiment reading is projected to come in at 80.0, down from July's final score of 85.1. That would be the second month-to-month decline for both, which doesn't reach "red alert" levels yet, but does merit keeping close tabs on.
Consumer Confidence
This week there's more data in the lineup, but not much of it that really matters.
We'll get durable orders numbers fir July on Monday. The pros are looking for a 0.6% increase when taking planes, trains, and automobiles out of the equation. Problem is, transportation makes up a huge part of the economy. The slump in that industry is expected to drive a 5.0% dip in overall durable orders for July. The market will react to that figure.
It's also going to be a big week for confidence measures. The Conference Board's consumer confidence score comes out on Tuesday, and the second (of three) Michigan Sentiment Index readings will be out on Friday. The former is expected to slump from 80.3 to 77.0 this time around, while the Michigan Sentiment reading is projected to come in at 80.0, down from July's final score of 85.1. That would be the second month-to-month decline for both, which doesn't reach "red alert" levels yet, but does merit keeping close tabs on.
Consumer Confidence
 Finally, on Friday we'll get July's personal income and personal spending changes. Normally these aren't market movers. But, given how marginal the economy's growth is right now, there's little from for error or weakness, and investors know it. Though the bar is already set low (at 0.1% growth for income and 0.3% growth for spending), any shortcoming has some significant leverage in tipping the scales in a bearish direction.
Stock Market
It's been this way for months now, so why should last week be any different? Just when the market appears poised to start a significant move, the folks sitting on the other side of the table find inspiration, and nobody else disputes their efforts. This time it was the bulls who staved off a major correction right as the sellers brought the market to the brink of an imposition. The question is, did the bulls actually fend off a meltdown or just delay it? Great question.
Beginning with the daily chart, first and foremost it should be noted that the rebound - which began on Thursday - wasn't prompted by any encounter with a technical floor or key support level. It was jump-started by a new widely-opinion that the Federal Reserve may be in a more simulative mood than many assumed just a few days earlier.
All well and good, but broadly speaking, reversals that appear out of nowhere without much (if any) technical support tend not to last. Take a look.
S&P 500 & VIX - Daily Chart
Finally, on Friday we'll get July's personal income and personal spending changes. Normally these aren't market movers. But, given how marginal the economy's growth is right now, there's little from for error or weakness, and investors know it. Though the bar is already set low (at 0.1% growth for income and 0.3% growth for spending), any shortcoming has some significant leverage in tipping the scales in a bearish direction.
Stock Market
It's been this way for months now, so why should last week be any different? Just when the market appears poised to start a significant move, the folks sitting on the other side of the table find inspiration, and nobody else disputes their efforts. This time it was the bulls who staved off a major correction right as the sellers brought the market to the brink of an imposition. The question is, did the bulls actually fend off a meltdown or just delay it? Great question.
Beginning with the daily chart, first and foremost it should be noted that the rebound - which began on Thursday - wasn't prompted by any encounter with a technical floor or key support level. It was jump-started by a new widely-opinion that the Federal Reserve may be in a more simulative mood than many assumed just a few days earlier.
All well and good, but broadly speaking, reversals that appear out of nowhere without much (if any) technical support tend not to last. Take a look.
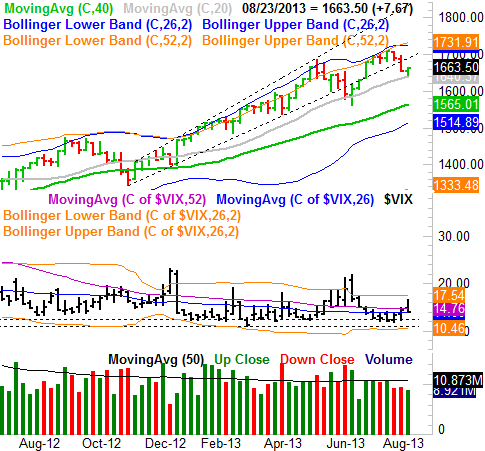
S&P 500 & VIX - Daily Chart
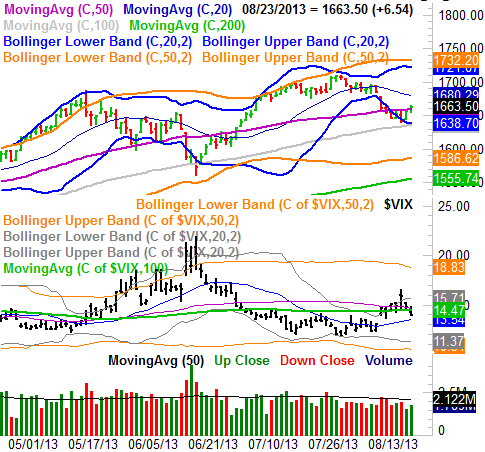 On the flipside, the S&P 500 (SPX) (SPY) crossed back above its 50-day moving average line (purple), which is a key momentum clue. The VIX also closed back beneath its 50-day moving average line (purple).
It all points to bullishness, but the biggest line in the sand has yet to be cleared by the VIX or the S&P 500. It's the 20-day moving average line (blue) for both. For the S&P 500 it's 17 points above where the index's close at 1663.50 on Friday. For the CBOE Volatility Index (VIX) (VXX), it's 0.44 points below Friday's close of 13.98. The S&P 500 could continue moving higher - and probably will - until the 20-day moving average lines are met by the VIX and the S&P 500. That's when the real test begins. Let's not get really bullish until those lines are crossed.
Not that it helps much this week, but for perspective, take a look at the weekly chart. On it you'll see just how strong last week's reversal bars were. Both the VIX and the S&P 500 made long-tailed candlestick dojis (a dragonfly doji for the weekly chart of the S&P 500, and a gravestone doji for the VIX). Long-tailed dojis like this express the strength of the reversal effort, which actually bodes bullishly for stocks in this case.
S&P 500 & VIX - Weekly Chart
On the flipside, the S&P 500 (SPX) (SPY) crossed back above its 50-day moving average line (purple), which is a key momentum clue. The VIX also closed back beneath its 50-day moving average line (purple).
It all points to bullishness, but the biggest line in the sand has yet to be cleared by the VIX or the S&P 500. It's the 20-day moving average line (blue) for both. For the S&P 500 it's 17 points above where the index's close at 1663.50 on Friday. For the CBOE Volatility Index (VIX) (VXX), it's 0.44 points below Friday's close of 13.98. The S&P 500 could continue moving higher - and probably will - until the 20-day moving average lines are met by the VIX and the S&P 500. That's when the real test begins. Let's not get really bullish until those lines are crossed.
Not that it helps much this week, but for perspective, take a look at the weekly chart. On it you'll see just how strong last week's reversal bars were. Both the VIX and the S&P 500 made long-tailed candlestick dojis (a dragonfly doji for the weekly chart of the S&P 500, and a gravestone doji for the VIX). Long-tailed dojis like this express the strength of the reversal effort, which actually bodes bullishly for stocks in this case.
S&P 500 & VIX - Weekly Chart
 Conflicting signals? Yes, which is why you'll want to keep things on a very tight leash this week. But, as things stand right now, the bulls have control until further notice. The 20-day moving average line at 1680 is going to be the S&P 500's next make-or-break level.
Trade Well,
Price Headley
BigTrends.com
1-800-244-8736
Conflicting signals? Yes, which is why you'll want to keep things on a very tight leash this week. But, as things stand right now, the bulls have control until further notice. The 20-day moving average line at 1680 is going to be the S&P 500's next make-or-break level.
Trade Well,
Price Headley
BigTrends.com
1-800-244-8736