Can The Bulls Keep Momentum As Earnings Season Begins - Weekly Market Outlook
Can The Bulls Keep Momentum As Earnings Season Begins - Weekly Market Outlook
Although the 4th of July meant a break for trading in the middle of last week, the bulls were still able to create some fireworks. Stocks advanced 1.6% last week, and made some important (even if subtle) technical progress by doing so. It may still be a little premature to assume the market's fully back in a bullish mode, but it's not too soon to start entertaining the possibility.
We'll recalculate the odds of continued bullishness below. First, let's poke and prod the economic numbers that inspired last week's rally.
Economic Calendar
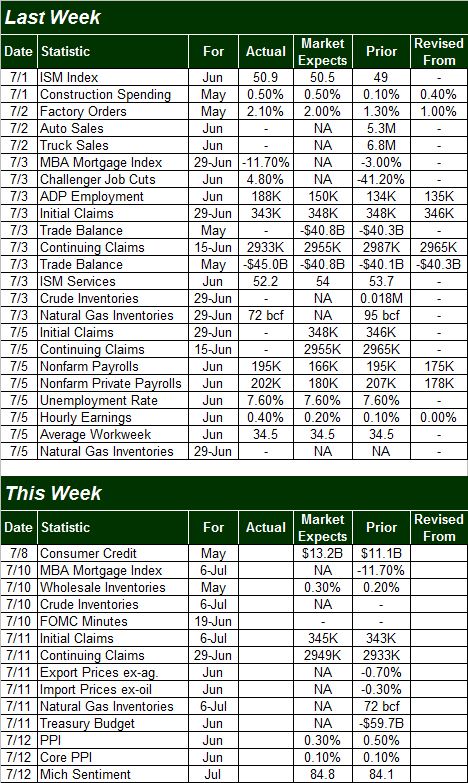
While it may have been a holiday-abbreviated week, there was certainly no shortness of economic data. Of course, the only part of it anybody really cared about was jobs-related news from the Department of Labor. Let's just start there, beginning with the biggest of the big news.
The unemployment rate as of the end of June is 7.6%, as it was in May, and as it's pretty much been since March. The economy added 195,000 new payrolls last month, according to the DOL ... a figure that roughly jives ADP's payroll-growth figure of 188,000 from a few days earlier (which was up from 134,000).
There was a lot of employment-related data you didn't hear about though, that you should have heard. One of those data nuggets is the fact that 144.06 million people in the U.S. are now employed , which is the highest level we've seen since late-2008. The labor force has grown too, since then, so don't pop the champagne corks just yet. But, the overall employed/population ratio finally edged up last month, from 58.6% to 58.7%. It's the second improvement in three months, and cements an improvement trend (albeit a very slow one) into place.
On other fronts, construction spending was up 0.5% for May, and factory orders grew 2.1% in May. Both were improvements on the prior month's numbers, and both came in pretty much as expected. Everything else is on the table below.
The coming week is minimal in terms of the amount of economic information we'll be getting. In fact, the only item of real interest is Friday's producer price inflation rates (and then only as a precursor to next week's consumer inflation data). Last month, the producer price inflation rate as well as the consumer price inflation rate both went up, halting what had become an alarming downtrend that was creeping towards outright deflation. The annualized PPI rate bounced back to 1.7%, from 0.6%. [For reference, last month's annualized CPI rate moved from 1.06% to 1.36%.] If we can log another increase there - without heating up too much - that would actually be a good thing.
Stock Market
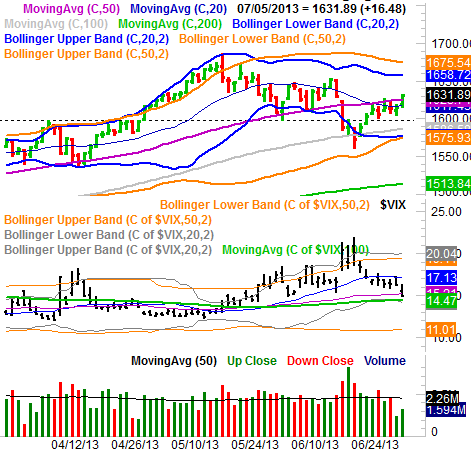
Last week, the S&P 500 (SPX) (SPY) crossed above its 50-day moving average line (purple). It's a big deal, as the 50-day average had been acting as a ceiling, after acting as a floor in mid-June. If this cross of the intermediate-term moving average line can be taken at face value, it's something for the bulls to get excited about. That's a very big 'if', however.
Friday's action was not necessarily an indication of the majority opinion right now. The volume for that session was the second-lowest volume day in two months, and the lowest volume day was from the half-day on Wednesday. It may have just been a few amateurs in a bullish mood doing their thing in Friday, and they just happened to not find any resistance from the professional-level bears.
Underscoring just how unusual Friday's session was is the big plunge from the CBOE Volatility Index (VIX) (VXX). Its dip doesn't quite jive with the action we've seen from the market. It's too low, likely the result of unchecked optimism for on that particular day. Sure, it's possible the VIX could be in a new downtrend, but that's not what this looks like. This looks like an errant move that's aching to be undone. We'll see.
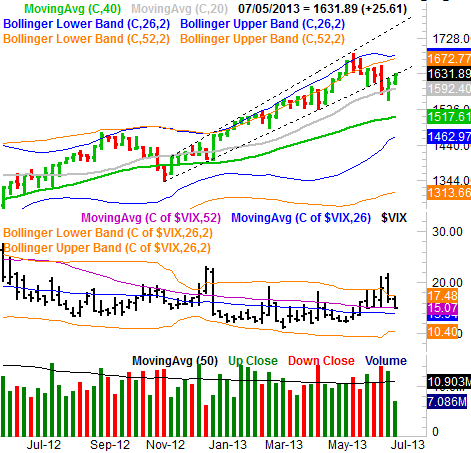
Truth be told, things start to take on a healthier shape when you look at a weekly chart. The S&P 500 is almost back inside that rising bullish channel (framed by dashed lines) after logging a strong reversal-oriented bar two weeks ago. And, on the weekly chart it appears the VIX has something of a shot at continuing to move lower,
In case you haven't figured it out yet, the market's next move is approximately a 50/50 proposition. The momentum is technically bullish, but if there was ever momentum not to trust, last week's is it. Most pros and institutional traders took the better part of last week, yielding the market to the amateurs for a couple of days. The big-time traders will take over again come Monday, and there's no guarantee they'll adopt the same tone that was established late last week. It truly is a "wait and see" situation. The catalyst for starting whatever is in the cards is, of course, earnings season, which starts right away with Alcoa's (AA) announcement. On that note...
Q2 Earnings Season Really Starts Next Week
Standard & Poor's says the S&P 500 is expected to earn $26.40 for the second quarter. That's 3.8% higher than the year-ago figure of $25.43, and 2.4% stronger than the Q1 final figure of $25.77. It's a completely doable number, though that doesn't guarantee the goal will be met.
Many say Alcoa's results set the tone for earnings season. They don't, however . That may have been the case thirty years ago, when aluminum - and manufacturing and industrial activity - were mainstays of the global economy. Now, however, Technology (XLK) and Financials (XLF) are the economy's cornerstones. Don't sweat Alcoa's numbers. Truth be told, we won't be getting any numbers worth worrying about until Friday, when JP Morgan Chase (JPM) and Wells Fargo (WFC) unveil last quarter's results. The earnings fireworks really don't start, however, until the following week.
Trade Well,
Price Headley
BigTrends.com
1-800-244-8736


