BigTrends.com Weekly Market Outlook - September 6, 2016

Weekly Market Outlook - Two Month Range Continues
Despite a couple of scares, stocks ended last week intact, and even up just a bit thanks to Friday's gain. On the other hand, last week's action still left the S&P 500 (SPX) (SPY) along with the other indices overvalued and overbought. Whether or not that matters remains to be seen, though it's interesting that the bears had more than ample opportunity to push the market over the cliff -- but they just never did it.
All the same, the first full week of the worst month of the year for stocks has begun. Let's see if Friday's bullishness lasted through the weekend. We're just as close to key technical floors as we are key technical ceilings.
We'll look at the details after weighing all of this week's and last week's key economic numbers.
Economic Data
There's little doubt as to last week's highlight... Friday's jobs report for August. Traders were waiting on it all week, though didn't quite know how to respond to its moderate data once it was unveiled - the interest rate picture is no clearer than it was (though the knee-jerk assumption was that the weaker payroll growth would indeed stave off a rate hike).
Last month, the nation added 151,000 new jobs, falling from July's 275,000, and falling short of the expected 180,000. It wasn't enough net progress to move the unemployment dial from 4.9%.
Payroll Growth and Unemployment Rate Chart

Source: Thomson Reuters
The jobs situation is better than the headline numbers would suggest, however. Participation in the labor force and the total number of people working continue to improve.
Labor Force Participation and Employment-to-Population Ratio Chart

Source: Thomson Reuters
Despite August's lull, the overall job growth trend leaves the Fed plenty of room and reason to push rates upward.
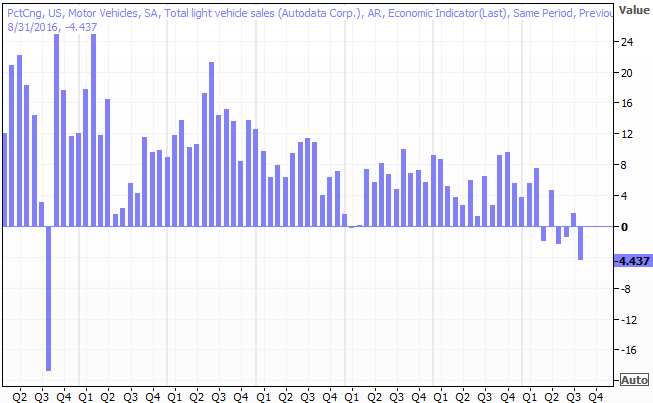
We also heard last month's automobile sales report last week. It too was a bit of a disappointment, rolling in at a pace of 16.98 million units per year, down 4.2% from August of last year. This downtrend is picking up steam. In four of the past six quarters, the industry has logged lower year-over-year numbers (and the deterioration is worsening). Although there's no real empirical evidence a rate hike would further crimp waning auto demand it certainly wouldn't help matters.
Auto Sales (Year-Over-Year Change) Chart
Source: Thomson Reuters
Finally, consumer confidence jumped from 96.7 to a multi-month high 101.1. It's an interesting disparity with the malaise we've seen from the Michigan Sentiment Index of late.
Consumer Confidence Chart

Source: Thomson Reuters
Everything else is on the following grid:
Economic Calendar

Source: Briefing.com
This week isn't going to be nearly as busy. In fact, the only items of interest will be Tuesday's ISM Services report, and Wednesday's JOLTS (Job Openings and Labor Turnover Survey) report, both of which will round out data from last week.
The ISM Services update will complete last week's manufacturing index number, which fell back under the critical 50.0 line (to 49.4), suggesting economic contraction. The services index is expected to fall too, though the projected reading of 54.7 is still above the all-important 50.0 level. Neither is overly impressive here.
ISM Index Chart

Source: Thomson Reuters
And, the JOLTS report will add some more color to last week's jobs update for August. Job openings have penetrated deep into record-high territory, bolstering the strength we've already seen (even if erratically) on the employment front.
JOLTS (Job Openings and Labor Turnover Survey) Chart

Source: Thomson Reuters
Stock Market Index Analysis
Since mid-July, the 2175 level on the SPX has been support as well as resistance, more than once. And, it's still playing that role... support, as of Friday (the low was 2173.59). Indeed, the 2175 mark seems to have its own gravity; the S&P 500 has made no net progress since mid-July because the index keeps making its way back to that line.
To that end, despite Friday's bounce, stocks remain very much on the fence here, capable of breaking under a key floor just as easily as they could break above an important ceiling.
Take a look. The recent highs near 2193 are apt to be a ceiling again now that the upper Bollinger band is there, while the frequently-found floor at 2158 is soon going to be bolstered by the 50-day moving average line. The boundaries have been established, for better or worse.
S&P 500 & VIX Daily Chart
Chart created with TradeStation
The daily chart of the NASDAQ Composite (COMP) doesn't look identical, though it does look similar. That is, it's trapped in a well defined range, which is augmented by its 20-day Bollinger bands. Considering the composite hasn't been able to break above its upper band line in weeks, Friday's touch of that line may well be a setup for yet another downward move within the range.
NASDAQ Composite & VXN Daily Chart

Chart created with TradeStation
Zooming out to the weekly chart of the S&P 500 we can get a little more perspective on what's going on here. That is, though the market may have logged a gain last week, it was only because of Friday's half-hearted bounce. Otherwise, stocks continue to feel the weight of their oversized gains since late June. We've still logged two consecutive weeks of lower lows and lower highs.
S&P 500 & VIX Weekly Chart

Chart created with TradeStation
The risk of a pullback is certainly there. What's not there is the certainty of that pullback. The market is certainly due for a correction (by historical standards). The bulls have been amazingly persistent though. Last week is another example of that persistence. When pushed to the tipping point, the bulls will push back. If this market is going to melt down as is often the case in September, it's going to have to break under the aforementioned floors first, and the CBOE Volatility Index (VIX) (VXX) is going to have to punch through its ceiling at 14.0. Until then, the BigTrends TrendScore for stocks -- at 86.2 -- says the bulls still have the wind at their back.
U.S. Dollar in Limbo
On Friday, after a tepid jobs report for August superficially suggested the Federal Reserve need not be in any hurry to raise rates, the value of the U.S. dollar (UUP) fell. Makes sense. Interest rates and a nation's currency tend to move in tandem, and traders betting on higher rates via the dollar started to unwind their positions.
A funny thing happened halfway through the day, however. The U.S. Dollar Index reversed course and ended the session with a gain, effectively saying rates are more likely to move higher than lower anyway.... or at least hold their ground.
U.S. Dollar Index Daily Chart
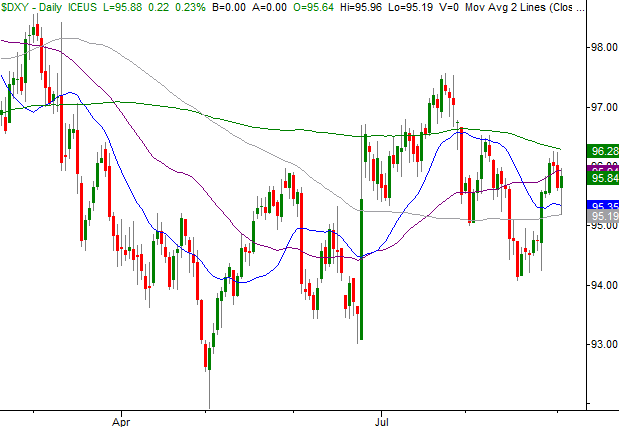
Chart created with TradeStation
It's an interesting situation. By most standards, the value of the dollar should be low and/or falling, but it's actually trying to make bullish progress. Since May we've seen higher lows and higher highs, and the index is within reach of a catalytic break above its 200-day moving average line (green).
The potential impact of such a move is troubling. Not only would a stronger dollar push the price of oil (USO) lower and put the energy sector (XLE) back in dire straits, but it would also work against U.S. companies that sell goods overseas. The strong dollar had been one of the reasons overall earnings growth has been tepid for a year now. It's worth keeping tabs on simply because many were hopeful that the strong dollar would finally abate. Now we can see it may not be ready to cool off.
Trade Well,
Price Headley
BigTrends.com
1-800-244-8736