BigTrends.com Weekly Market Outlook - June 27, 2016
Weekly Market Outlook - Where Things Stand After Brexit
Through Thursday, not only was the market's action palatable, it was downright bullish. Investors were increasingly confident the Brexit wouldn't happen. Big mistake. When traders realized the "leave" crowd just edged out the "remain" crowd, it pulled the rug out from underneath the bullishness. When all was said and done, Friday's 3.6% plunge from the S&P 500 (SPX) (SPY) translated into a loss of 1.6% for the week.
Now what? Good question. Perhaps the one-day drubbing was enough to hit the market's proverbial reset button. Or, maybe there just wasn't time and room to sell any more stocks on Friday, and the bears will pick up where they left off come Monday morning. The arguments from both sides of the table are surprisingly strong.
We'll look at the bullish and bearish cases in a moment, after a quick run-down of last week's and this week's economic news.
Economic Data
Last week didn't dish out a whole lot of economic news, but most of what we got was important stuff. For instance, we got an updated feel for how things look on the real estate front with an update on new-home and existing-home sales.
In short, we continue to see strength there. Existing-home sales perked up to a multi-year high pace of 5.53 million, and though new-home sales fell to a pace of 551,000, they're still in a broad uptrend. In both cases we can see that inventory remains at minimal levels, perhaps serving as something of a bottleneck.
New, Existing Home Sales Chart
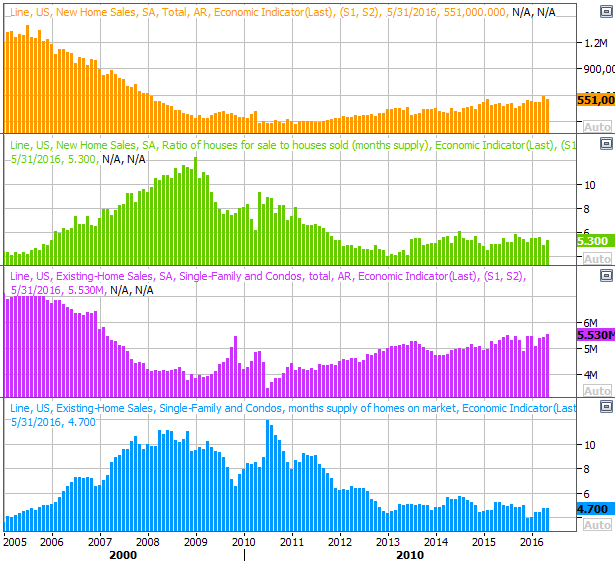
Source: Thomson Reuters
We also heard a surprisingly disappointing durable orders report for May, with or without (usually volatile) transportation orders. Even taking planes, trains, and automobiles out of the equation, orders slumped 0.3% rather than growing the anticipated 0.5%.
While the month-to-month changes don't actually tell is much (ignoring seasonal changes and ignoring cases where the prior month's total is a statistical outlier), our chart below also plots the raw durable orders data (green, bottom). It's here we can see it looks like durable orders -- which includes transportation orders -- have already peaked.
Durable Orders Chart
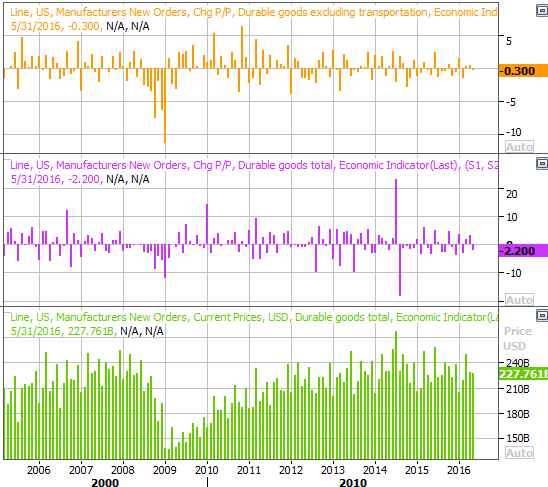
Source: Thomson Reuters
Everything else is on the following grid:
Economic Calendar
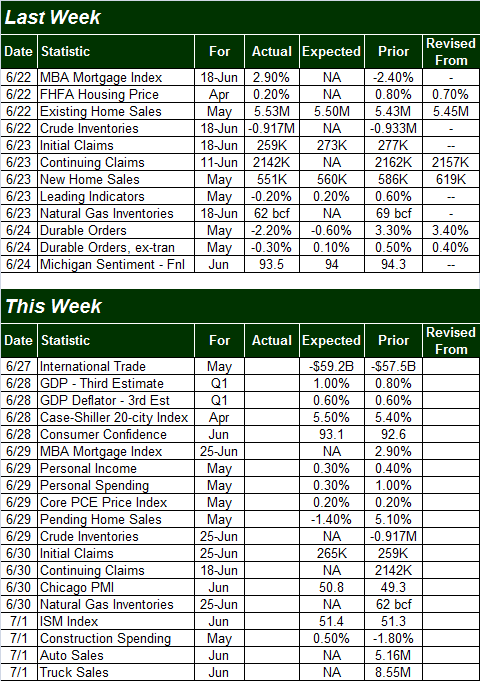
Source: Briefing.com
This week will be much busier, kicking off with Monday's third and final look at Q2's GDP data. The pros say it should roll in at 1.0% growth, up from the 2nd estimates of 0.8%. The chart below doesn't plot any of the preliminary Q1 readings; it just plots the final Q4-2015 growth rate. But, you can see that versus a reading of +1.4% in Q4, we're slowing down no matter what figure comes in on Monday.
GDP Growth Chart
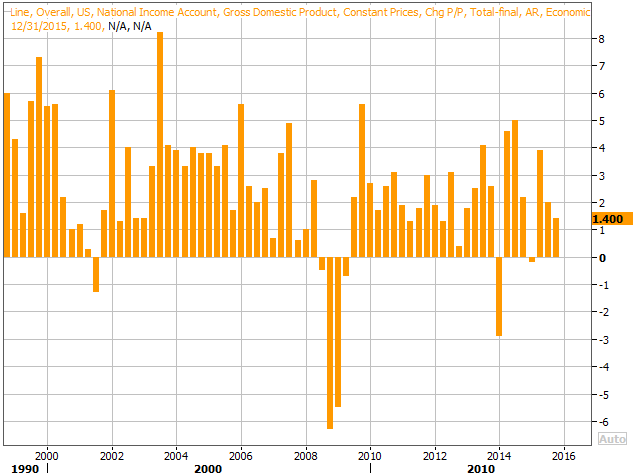
Source: Thomson Reuters
It's also going to be a big week for consumer confidence scores (though some of the scores may have been tallied before Brexit). You may have seen we got the final Michigan Sentiment Index reading for June on Friday, but this week we'll round it out with June's Conference Board consumer confidence score. Analysts expect a slight uptick, from 92.6 to 93.1. Even with the modest move higher though, the Conference Board's measure is in a downtrend even as the Michigan reading looks to be somewhat improving.
Consumer Confidence Chart
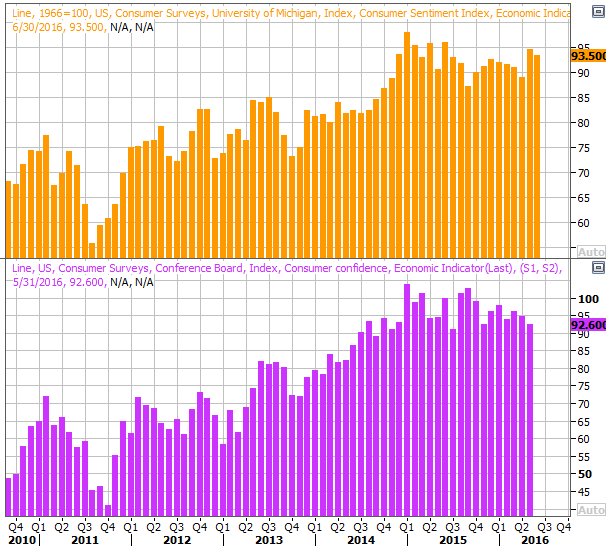
Source: Thomson Reuters
Last but not least, though it's not usually a piece of data we're too concerned about, in light of the "peak auto" debate that was stirred up a few months back, it may be worth looking at Friday's auto sales figures relative to recent levels. Car sales have been falling since late last year, but now, even truck sales seem to be hitting a headwind. This report could be quite catalytic, for the better or the worse.
Automobile Sales Chart
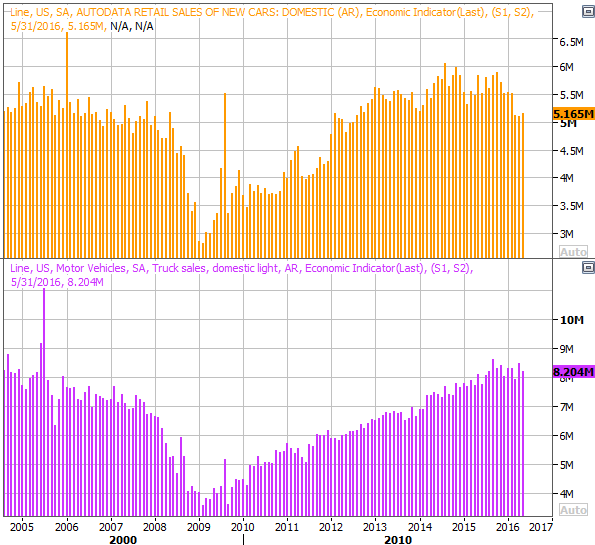
Source: Thomson Reuters
Stock Market Index Analysis
Broadly speaking, currently you can throw most conventional technical analysis strategies (not to mention most fundamental forms of analysis) right out the window. Friday's Brexit decision and subsequent plunge from stocks turned the market into nothing less than a melee. From here, we can only really speak of possibilities and plausibilities... and we have to give the bullish case as much credence as the bearish case.
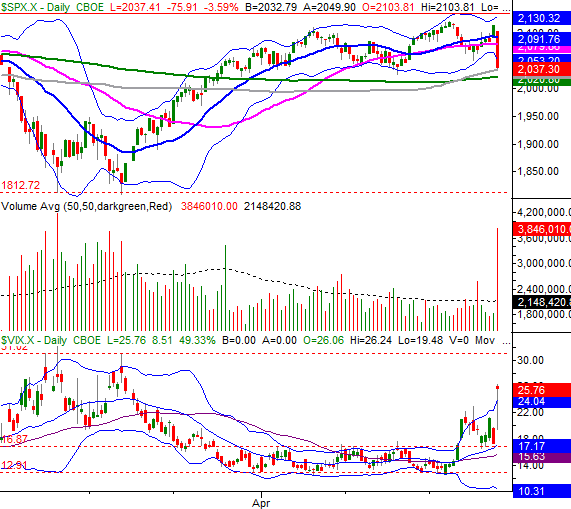
The daily chart of the S&P 500 below largely speaks for itself. Things were fine right up until a presumed "remain" vote ended up being a "leave" vote, jolting the market out of a broad uptrend.
Take a closer look at the chart, however. The selling was strong right up until the point where the semi-pivotal 100-day moving average line (gray) stepped up to the plate and stopped the selling. At the same time, the volume from Friday's selloff was enormous.... levels often seen on capitulation days. And, the CBOE Volatility Index (VIX) (VXX) moved higher at an uncomfortably brisk pace, which is also something often seen when stocks are racing to a bottom.
S&P 500 & VIX Daily Chart
Chart created with TradeStation
Feeling like a bounce is in the making? Not so fast.
While the daily chart is dramatic, zooming out to a weekly chart of the S&P 500 makes Friday's stumble not-so-shocking. In fact, from this perspective last week's weakness just looks like a continuation of the bearish reversal bar put in place three weeks ago after the index bumped into a technical ceiling at 2115, which has prompted pullbacks a couple different times since late-2015. It's also on this chart we can see the VIX hasn't necessarily reached its highest realistic peak just yet. That's around 31.0.
S&P 500 & VIX Weekly Chart
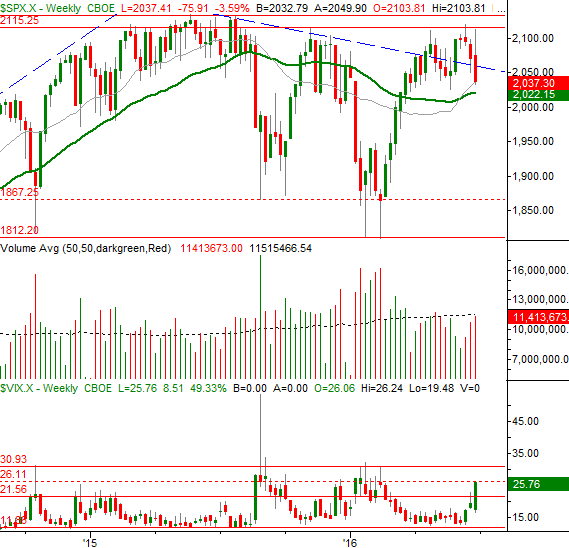
Chart created with TradeStation
This is something of a coin toss.
Realistically speaking, odds are good the sheer scope and size of Friday's setback will result in a bullish pushback sooner than later. That doesn't necessarily mean it will last, however. The market was already vulnerable to a pullback. The Brexit vote just gave traders the nudge they needed to start taking profits again.... as they had a couple times already within the past several months when stocks reached this level.
Of course, until the S&P 500 breaks below the 200-day moving average line at 2022, there's no real assurance the sellers will stage a repeat performance. Conversely, until 2115 -- and really, 2135 -- is good and hurdled, there's not a lot of reason to have bullish hope. And of the two, in light of the current earnings outlook and frothy market valuation, weakness seems the more likely outcome out this time... even if it takes a few days to regroup.
Trade Well,
Price Headley
BigTrends.com
1-800-244-8736