Bears Tipping The Scales - Weekly Market Outlook
Bears Tipping The Scales - Weekly Market Outlook
So much for the rebound effort. After a glimmer of hope of a rebound surfaces two weeks ago, the sellers took charge again last week, carrying the market to new multi-week lows. It was the third losing week in the past four, and the major stock indices fell below yet-another key line. It's not looking good.
We'll detail that pessimism in a moment (and also add the caveat). First, let's paint the bigger picture using the broad brush stroke of last week's economic data.
Economic Calendar
While there wasn't much in the way of economic data last week, little of what we got was good news.
The week kicked off on the wrong foot, with durable orders falling 7.3% in July. Granted, when taking out usually-volatile transportation orders, the plunge was paired down to only a 0.6% decline, transportation is a huge part of the economy and should be factored in. [By the way, overall durable orders were up 3.9% for June, so we're still losing ground, even with a long-term view.]
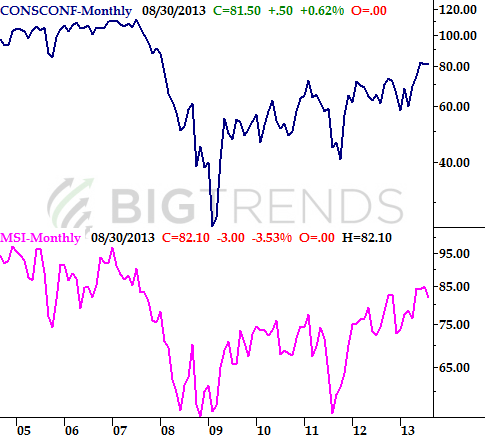
It was also a big week for consumer confidence scores, though we didn't see any big changes. The Conference Board's consumer confidence score was up a little, from 81.0 to 81.5, while the Michigan Sentiment Index fell from 85.1 in June to 82.1 for last month. Both are still in long-term uptrends, though, so no need to be concerned.
Consumer Confidence
Personal income as well as personal spending both grew by 0.1% last month, which is better than a contraction, but still a pretty weak result.
One smidgen of encouraging news (even if it's old news now)..... the second quarter's estimated GDP growth rate was raised from 2.1% to 2.5%, on an annualized basis. One good quarter does not make or break a trend, but it's a good start. On the other hand, we're now two months into the following quarter, and the past two months - neither of which were part of Q2 - haven't been all that great in terms of economic numbers.
Economic Calendar
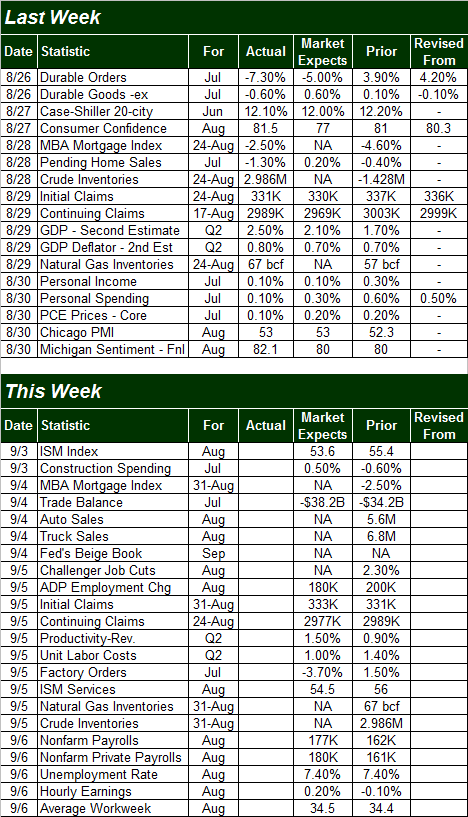
This week's got more in store, though there's only one focal point... the employment situation.
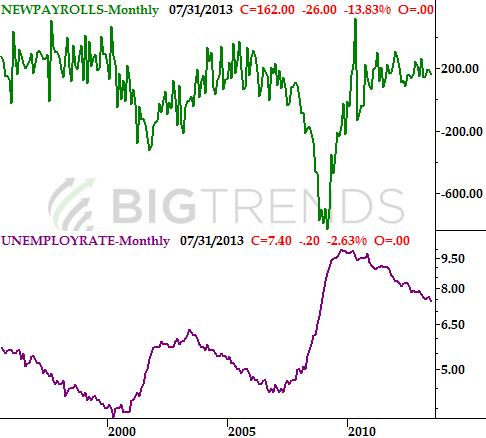
The wave of jobs-related data kicks off on Thursday with the Challenger job cuts expectations and the ADP Employment change figure. No word yet on the job cuts estimate, but the ADP new-payrolls figure is expected to fall from June's 200,000 new jobs to only 180,000. The final tally jives with 180,000 new jobs the Department of Labor is expected to announce on Friday, though the DOL's figure would actually indicate groin from June's total of 161,000 new payrolls. Clearly the entire jobs-growth picture is a fuzzy one. Whether you see the glass as half-empty of half-full, however, is a little irrelevant. Anything less than 400,000 new payrolls per month isn't enough to spur significant economic growth, or even net job growth, which is why economists don't expect the unemployment rate to change from June's reading of 7.4%.
Payroll Growth, Unemployment
Stock Market Index Outlook
It may seem a little tedious, but to effectively make a handful of key points, we're going to look at a couple of indices each in a couple of different timeframes this week. Each illustrates something worth pointing out.
Starting with the S&P 500 (SPX) (SPY), while last week's 30.53 point (-1.8%) dip to 1362.97 was inarguably bearish, it may have been even worse that it feels. That pullback carried the S&P 500 beneath the 100-day moving average line (gray).
And it wasn't just a move under the 100-day moving average line that screams bearishness. We've traded under the 100-day line before without jump-starting a bigger selloff; just go back to the low from late June to see. The SPX dipped a bit beneath that line for one day, then sprang to life the next day. This time is different than late June. This time, not only has the S&P 500 not bounced back to life, it looks as if the 100-day moving average line is now acting as resistance, quelling any rally effort before it has a chance to get going.
S&P 500 & VIX - Daily Chart
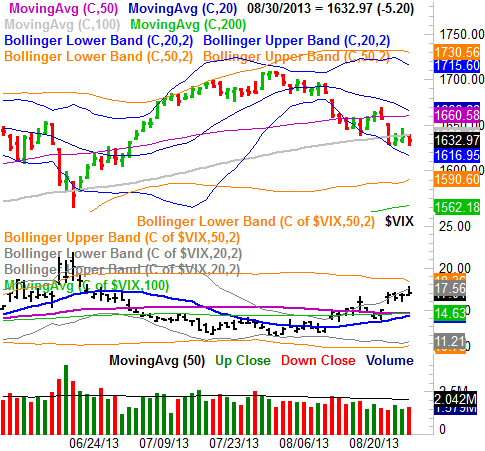
With all of that being said, the weekly chart we looked at two weeks ago was already bearish, but became even more so after last week's dip... some of the red flags from then began to wave even more. Namely, the S&P 500's break under a long-term support line (dashed) that happened three weeks ago has now reached irreversible depths. We can also see on the weekly chart how the CBOE Volatility Index (VIX) (VXX) is pushing up and into its upper Bollinger band at 17.76 [the weekly chart of the VIX gives us some perspective on the budding upward undertow that we're not seeing on the VIX's daily chart]. Although the VIX has hurdled that upper Bollinger band before without putting the market into a nosedive, this time feels different.
S&P 500 & VIX - Weekly

So it bad news across the board? Well, it's the bigger picture isn't encouraging, but the NASDAQ's (COMP) (QQQ) charts show us a path the bulls could take to sidestep a more significant correction. But, the bulls will have to get on that path ASAP.
The key to the NASDAQ (and thereby the whole market) staving off a correction is continuing to find support at 3576. If that number rings a bell, it may be because it was the low from late July. The bulls drew a line in the sand there this past week too. It's also where the Composite's 50-day moving average line as well as the lower Bollinger band have intersected as of last week. Point being, there's a major floor in place here, if the bulls decide to use it.
NASDAQ Composite & VXN - Daily
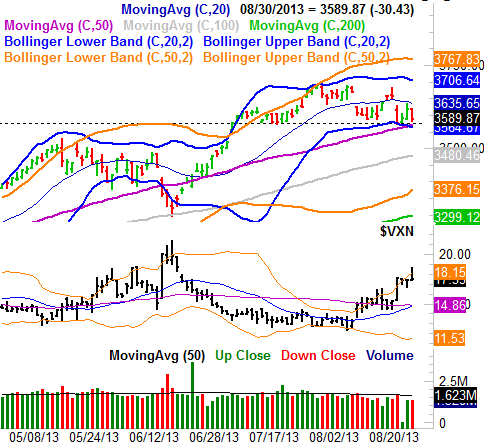
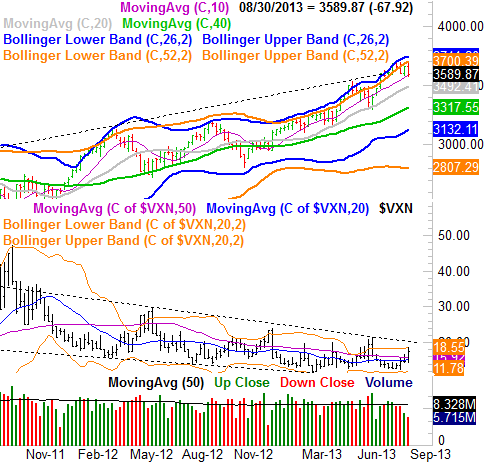
Nothing really changes when you look at a weekly chart of the NASDAQ Composite, but we do see a pending clue when we look at the daily chart. Although the S&P 500's VIX hasn't made it as clear, the NASDAQ's Volatility Index - the VXN - has a clear ceiling in place at 20.5. That line (dashed) tags all the major peaks from the VXN going back to mid-2012. If the VXN moves above that line, count it as another bigger bearish clue.
NASDAQ Composite & VXN - Weekly
Bottom line? While we're getting something of a mixed message here, the scales are tipped in favor of the bears. There's just enough doubt, however, to keep us/you on the sidelines. One more weekly loss may wipe away the last lingering bullish possibility, which means this week is a critical one. If we do make - and close at - new weekly lows, the potential downside is another 5% or more. We'll look at those exact floors when and if the time comes.
Trade Well,
Price Headley
BigTrends.com
1-800-244-8736