Back From The Brink - Weekly Market Outlook
Once again, just when it looked like stocks were going to pass the point of no return, good news regarding Greece's debt day the bulls a reason to celebrate on Friday. It wasn't enough to bring the market back into the black for the week, but just barely. More important, Friday's bounce gave investors just enough hope to keep the bullish case alive for some.
We'll look at everything below, as usual, but let's first run down some key economic numbers.
Economic Data
There wasn't much in the way of economic data from last week. In fact, the only item of real interest was the previous week's jobless claims. Initial claims jumped from 282,000 to 297,000, hitting a multi-week high, while ongoing claims reached 2.334 million, up from 2.265 million in the previous week. Although the slight uptick was treated with alarm, in the grand scheme of things it was only a slight bump in the road. The chart below puts things in perspective.
Initial and Continuing Unemployment Claim Chart
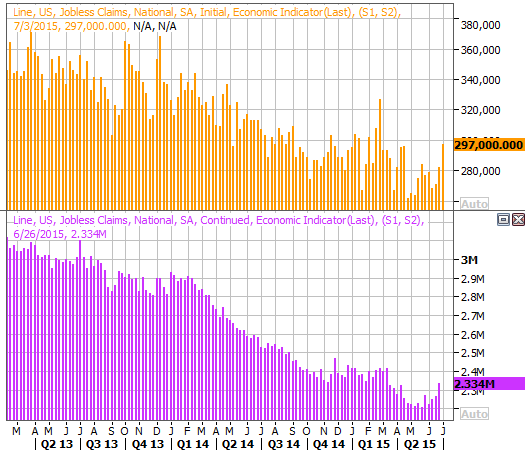 Source: Thomas Reuters
Although it's nothing that can be charted, we did get the minutes from June's Federal reserve meeting last week as well. Janet Yellen and the Fed governors were largely unwavering from their opinion that a rate hike is still a necessary evil in the foreseeable future. Bear in mind, however, that much has changed between the time that meeting was held and when the meetings minutes were released. Namely, Greece and China imploded. Even so, it remains to be seen if what's happened in the meantime will alter the Fed's plans.
Everything else is on the following grid:
Economic Calendar
Source: Thomas Reuters
Although it's nothing that can be charted, we did get the minutes from June's Federal reserve meeting last week as well. Janet Yellen and the Fed governors were largely unwavering from their opinion that a rate hike is still a necessary evil in the foreseeable future. Bear in mind, however, that much has changed between the time that meeting was held and when the meetings minutes were released. Namely, Greece and China imploded. Even so, it remains to be seen if what's happened in the meantime will alter the Fed's plans.
Everything else is on the following grid:
Economic Calendar
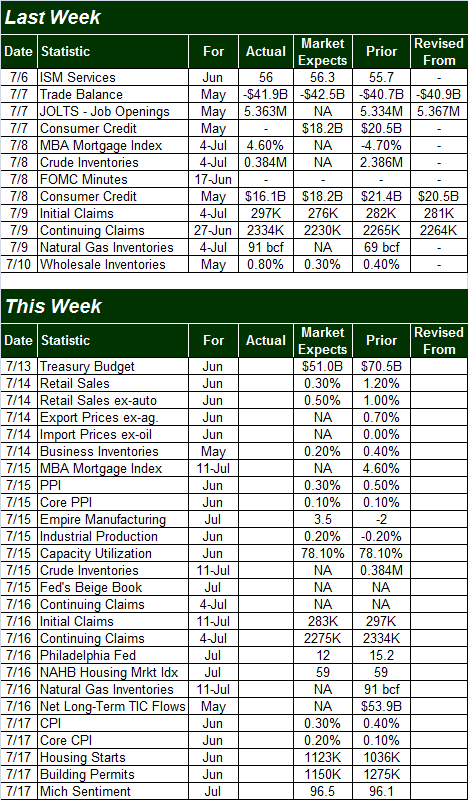 Source: Briefing.com
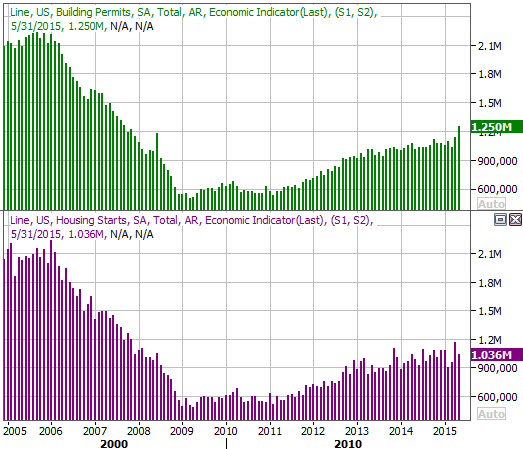
This week is going to be considerably busier on the economic front, starting with June's retail sales report due on Tuesday. On Wednesday we'll hear from the Federal Reserve regarding industrial production and capacity utilization. And on Friday, we'll get the building permits and housing starts data, both of which have been trending higher quite nicely.
Housing Starts and Building Permits Charts
Source: Thomas Reuters
In terms of economic data, more than anything else in the coming week, investors' eyes are going to be fixated on June's inflation numbers. Producer inflation is due on Wednesday, and the consumer inflation report is due on Friday.
Stock Market Index Analysis
As it has done for months now, the market continues to basically talk out of both sides of its mouth. The trend may have been bearish as of Wednesday, but Friday's bounce was just enough to keep traders thinking bullishness is in the cards... enough hope to actually make it happen.
To be clear, right now it's up to the bulls to "prove it." The bears can largely coast to near-term lower lows from here, having done enough technical damage already. It all still very much hangs in the balance though.
Let's start with a look at the weekly chart of the S&P 500 (SPX) (SPY) this week, just for the proper perspective. As you'll see, the downtrend is still technically intact by virtue of the falling MACD lines, in addition to the fact that the S&P 500 is below its 26-week moving average and has now logged a healthy string of lower lows and lower highs.
S&P 500 & VIX Weekly Chart
Source: Briefing.com
This week is going to be considerably busier on the economic front, starting with June's retail sales report due on Tuesday. On Wednesday we'll hear from the Federal Reserve regarding industrial production and capacity utilization. And on Friday, we'll get the building permits and housing starts data, both of which have been trending higher quite nicely.
Housing Starts and Building Permits Charts
Source: Thomas Reuters
In terms of economic data, more than anything else in the coming week, investors' eyes are going to be fixated on June's inflation numbers. Producer inflation is due on Wednesday, and the consumer inflation report is due on Friday.
Stock Market Index Analysis
As it has done for months now, the market continues to basically talk out of both sides of its mouth. The trend may have been bearish as of Wednesday, but Friday's bounce was just enough to keep traders thinking bullishness is in the cards... enough hope to actually make it happen.
To be clear, right now it's up to the bulls to "prove it." The bears can largely coast to near-term lower lows from here, having done enough technical damage already. It all still very much hangs in the balance though.
Let's start with a look at the weekly chart of the S&P 500 (SPX) (SPY) this week, just for the proper perspective. As you'll see, the downtrend is still technically intact by virtue of the falling MACD lines, in addition to the fact that the S&P 500 is below its 26-week moving average and has now logged a healthy string of lower lows and lower highs.
S&P 500 & VIX Weekly Chart
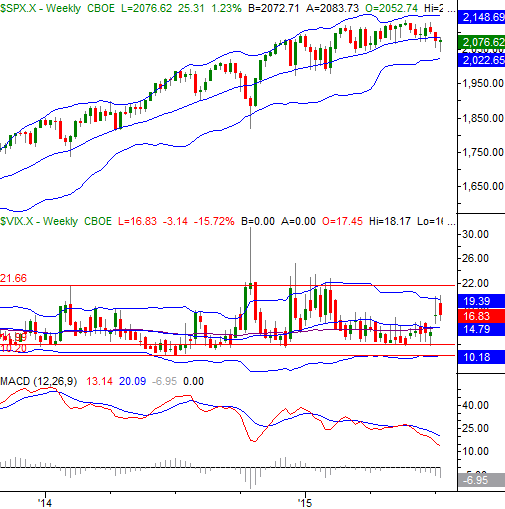 Chart created with TradeStation
On the flipside, there's no way of denying the CBOE Volatility Index (VIX) (VXX) is hesitating at the upper Bollinger band line. It did so last week, but that could have been chalked up to a transitory move. To see the weekly VIX test but not hurdle its upper Bollinger for a second week in a row, though, is noteworthy.
Zooming into a daily chart we can see even more recent reason for hope. Yes, the S&P 500 broke under a key support level at 2072 two weeks ago, and fell back under that mark - to an even lower low - for a short period of time last week. Then on Friday, all of that damage was undone with a big bounce back to a close of 2076.62. It was a low-volume effort, but in that the VIX looks and feels overextended, Friday's rebound effort look like it has legs.
S&P 500 & VIX Daily Chart
Chart created with TradeStation
On the flipside, there's no way of denying the CBOE Volatility Index (VIX) (VXX) is hesitating at the upper Bollinger band line. It did so last week, but that could have been chalked up to a transitory move. To see the weekly VIX test but not hurdle its upper Bollinger for a second week in a row, though, is noteworthy.
Zooming into a daily chart we can see even more recent reason for hope. Yes, the S&P 500 broke under a key support level at 2072 two weeks ago, and fell back under that mark - to an even lower low - for a short period of time last week. Then on Friday, all of that damage was undone with a big bounce back to a close of 2076.62. It was a low-volume effort, but in that the VIX looks and feels overextended, Friday's rebound effort look like it has legs.
S&P 500 & VIX Daily Chart
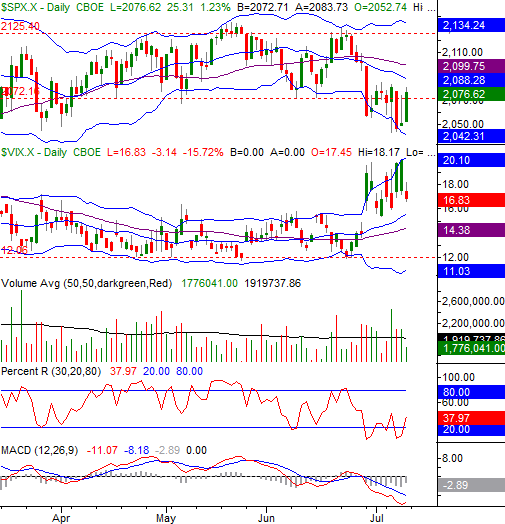 Chart created with TradeStation
On the flipside, even a little more upside movement from here may not be game-changing. The S&P 500 needs to get back above the 50-day moving average line (at a minimum) before we can really seriously entertain the notion of significant bullishness.
In other words, we're in a proverbial no-man's land, waiting for some more convincing clues.
The Percent R indicator verifies the idea that things are neither bullish nor bearish at this time - it's in the middle zone between 20 and 80. It needs to be outside of that zone to be convincingly bullish or bearish. Yes, the Percent R line is still closer to the bearish 20-level, but as of Friday, this indicator is pointed upward, towards 80.
Again though, the onus is still on the bulls to restore bullish confidence. The bears still have a little more technical control than the
Here's the daily chart of the NASDAQ Composite (COMP) , for some additional perspective. There's a big floor developing at 4903, and there's some room for the composite to keep rising before it bumps into a ceiling at 5043 where the 20-day and 50-day moving average lines are close to converging. That said, the fact that the 20-day line is on the verge of crossing under the 50-day moving average line for the first time in months points to just how bearish the undertow has been, and still may be.
NASDAQ Composite & VXN Daily Chart
Chart created with TradeStation
On the flipside, even a little more upside movement from here may not be game-changing. The S&P 500 needs to get back above the 50-day moving average line (at a minimum) before we can really seriously entertain the notion of significant bullishness.
In other words, we're in a proverbial no-man's land, waiting for some more convincing clues.
The Percent R indicator verifies the idea that things are neither bullish nor bearish at this time - it's in the middle zone between 20 and 80. It needs to be outside of that zone to be convincingly bullish or bearish. Yes, the Percent R line is still closer to the bearish 20-level, but as of Friday, this indicator is pointed upward, towards 80.
Again though, the onus is still on the bulls to restore bullish confidence. The bears still have a little more technical control than the
Here's the daily chart of the NASDAQ Composite (COMP) , for some additional perspective. There's a big floor developing at 4903, and there's some room for the composite to keep rising before it bumps into a ceiling at 5043 where the 20-day and 50-day moving average lines are close to converging. That said, the fact that the 20-day line is on the verge of crossing under the 50-day moving average line for the first time in months points to just how bearish the undertow has been, and still may be.
NASDAQ Composite & VXN Daily Chart
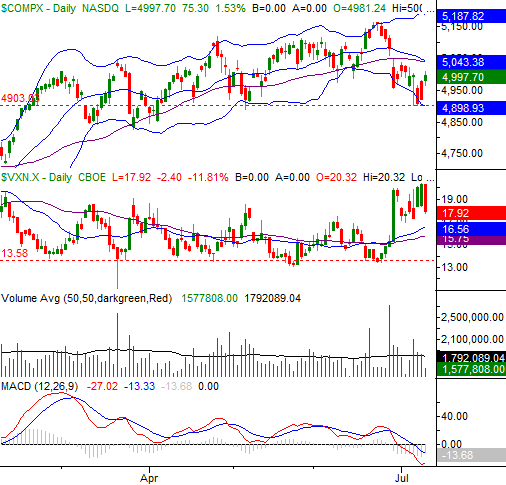 Chart created with TradeStation
Of course, whether or not Europe decides to accept Greece's debt decision is a huge wild card that could solidify or completely unwind all the clues discussed above.
Treasuries, Yields Resume Bigger Trends
Two weeks ago we pointed out that 30-year Treasury Bond (TLT) values and their inversely-correlated yields had both moved into long-term trends... bearish for treasuries, and bullish for yields. We also pointed out then, though, that their respective trends may be due for short break before resuming those trends. We finally got that break last week, but more than that, we may already have the resumption of the bigger trends.
Treasury Index & Treasury Yield Chart
Chart created with TradeStation
Of course, whether or not Europe decides to accept Greece's debt decision is a huge wild card that could solidify or completely unwind all the clues discussed above.
Treasuries, Yields Resume Bigger Trends
Two weeks ago we pointed out that 30-year Treasury Bond (TLT) values and their inversely-correlated yields had both moved into long-term trends... bearish for treasuries, and bullish for yields. We also pointed out then, though, that their respective trends may be due for short break before resuming those trends. We finally got that break last week, but more than that, we may already have the resumption of the bigger trends.
Treasury Index & Treasury Yield Chart
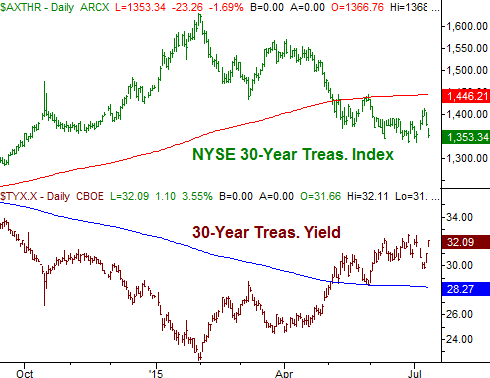 Chart created with TradeStation
A move to lower lows (below 1336) for the treasury index and higher highs (above 3.25%) for yields could be catalysts for even stronger moves in those directions, now that the ball is rolling.
Trade Well,
Price Headley
BigTrends.com
1-800-244-8736
Chart created with TradeStation
A move to lower lows (below 1336) for the treasury index and higher highs (above 3.25%) for yields could be catalysts for even stronger moves in those directions, now that the ball is rolling.
Trade Well,
Price Headley
BigTrends.com
1-800-244-8736