You're Not Imagining It. The NASDAQ Really Is (Way) More Bullish Than Other Indexes Right Now.

If it feels to you like the NASDAQ Composite has been decidedly outperforming the S&P 500 or the Dow Jones Industrial Average of late, you're not crazy. It is. And, there's a buried message in the disparity.
But, first things first.
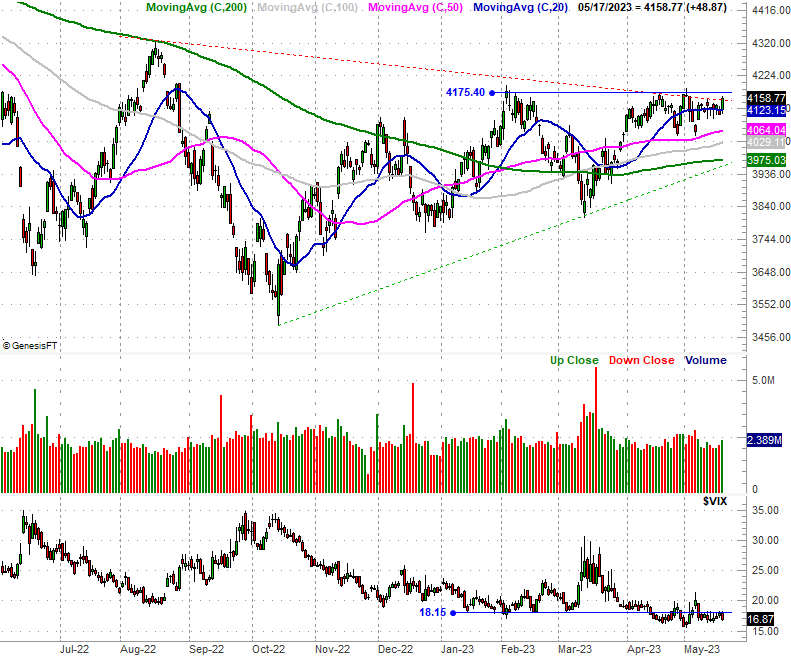
As was noted in Sunday's Weekly Market Outlook, although the S&P 500 hasn't made any meaningful progress beyond a major technical ceiling at (red, dashed). Never even mind the horizontal ceiling (solid, blue) at 4175, which hasn't been tested since the beginning of this month.
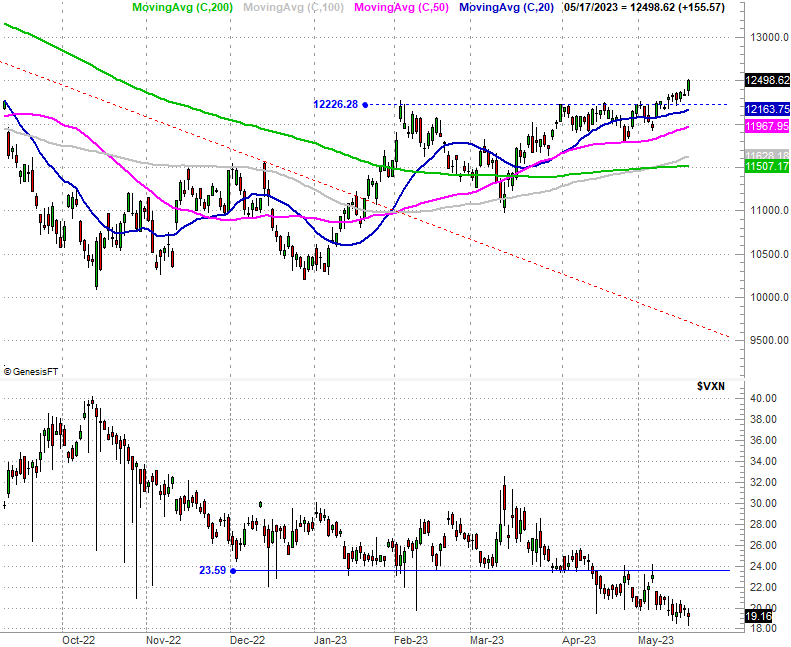
Not so for the NASDAQ. It punched through its ceiling at 12,226 a couple of weeks back, and is still putting some distance between itself and that line in the sand.
The thing is, it's not like these clearly-different performances can be chalked up as a coincidence to be disregarded. Investors are making a clear decision to buy the more aggressive growth stocks often listed as NASDAQ names at the expense of the average NYSE-listed blue chip that's found in the Dow or even the S&P 500.
The proof of this premise lies in the market's breadth and depth. That is to say, there's a lot of buying volume for NASDAQ stocks, and most of them are making more forward progress than not. NYSE-listed stocks, conversely, aren't being bought en masse, and most of them aren't heading higher on a daily basis here.
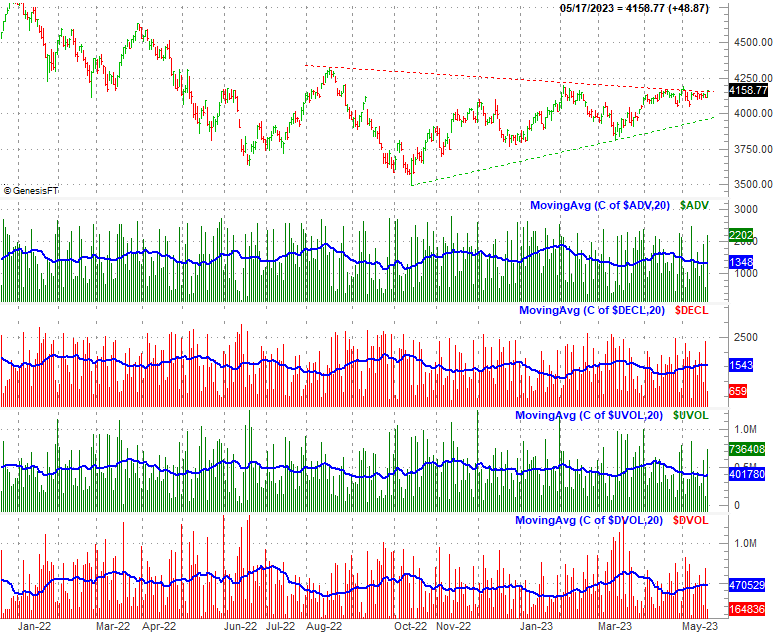
Take a look. The chart below compares the NASDAQ Composite to the exchange's daily up volume and daily down volume, and the exchange's daily advancers and daily decliners. The daily data for all of these is too erratic to interpret on its own. So, to make it easier to identify trends, a 20-day moving average line for each data set has also been plotted on each portion of the chart. While far from completely lopsided, the past several days have seen a firm bullish bias of the NASDAQ's advancers-vs-decliners and its up-volume vs. down-volume. The volume data has turned particularly bullish this week.

Now compare the NASDAQ's breadth and depth to that of the NYSE, compared to the S&P 500 index on the graph below. The NYSE's up-volume has been sliding lower since late last month, while its down-volume trend has been moving higher since the same point. Ditto for the exchange's advancers and decliners. They've been leaning bearishly (or not-bullishly) since late last month.
There are periods of slight differences in these two data sets. Not to this degree though, and not this long. The NASDAQ is clearly drawing a crowd of buyers, and drawing them away from NYSE stocks.
In some regards it's less than ideal for a rally. Sustainable rallies tend to have participation on all fronts, in all ways, with all kinds of stocks. We're not seeing that now. That should be something to keep in mind at this time.
If there's only one exchange dishing out bullish breadth and depth though, the NASDAQ is the one the bulls want to see it from. It leads the market higher and lower. To see it leading now suggests the NYSE's stocks and other indices will eventually follow suit.
Of course, the S&P 500 still needs to hurdle the resistance level at 4175 before we can entertain the prospect of another bullish leg.
Never say never though. While the summertime is -- on average -- a slow, no-progress period for the market, a small number of terrible years are weighing the average down. In bullish years (like this one), stocks tend to do just fine between May and September. The NASDAQ's current strength suggest that's what the market's trying to set up this time around.