Yes, the Santa Claus Rally is (Usually) for Real
Though the so-called Santa Claus rally -- the noteworthy bullishness that usually materializes between the Christmas break and New Year's Day -- gets plenty of lip service this time of year, few of those who talk about it as a tendency every actually validate the theory. It's a real thing, though, as our chart below can verify.
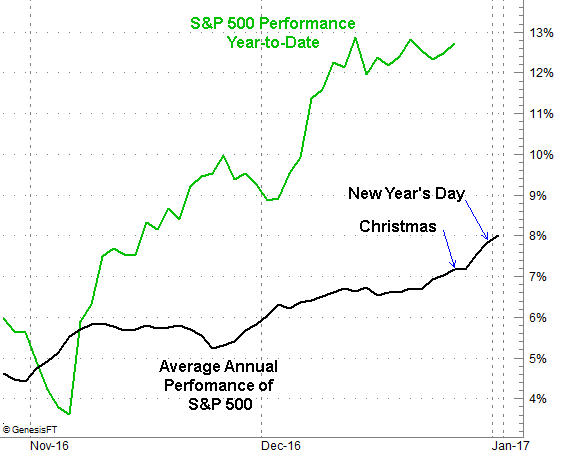
The graphical representation is the S&P 500's average day-today performance over the course of the calendar year, plotted in black, going back to 1940. The green line is the 2016-to-date performance of the S&P 500 (through Tuesday, December 27th). We've zoomed in to just the last two months of the year for greater clarity. Clearly there is more often than not a wave of strong buying to end the year.
Chart created with TradeNavigator
Specifically, the S&P 500 logs a gain of 0.9% this week, on average. It's not a huge advance, but it's significant for just one week... and reliable. The index makes a gain of some size about three-fourths of the time this week.
That being said, if there was ever a time for the Santa Claus rally to not take shape, this year is the year for it not to happen. The year-to-date performance is already oddly overheated, with the S&P 500 up 12.7% since the end of 2015. Normally it would only be up 7.9% by this point in the year. There may bot be a lot (if any) room for upside now.
That's the gut-feeling/realistic-instinct suspicion anyway. The market has a funny way of defying the odds though, and this year's likelihood of doing the unthinkable is no less than the unthinkable happening in any other year.
Since it's almost that time of year and appropriate to start planning for it, let's back-track a bit to the very beginning of 2016 and get a glimpse of how the S&P 500 performs in January and February of the typical year.
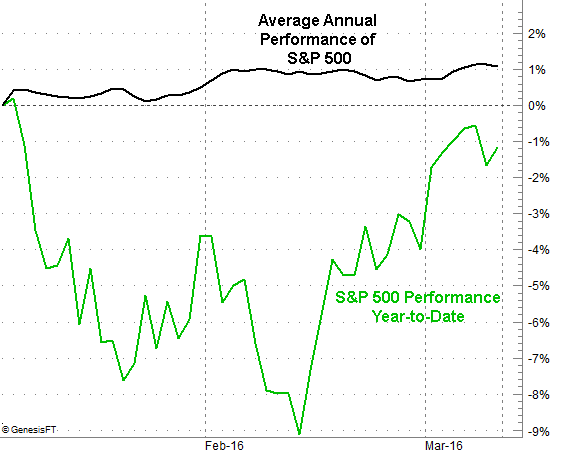
Chart created with TradeNavigator
Yes, the S&P 500's performance in January of this year was abysmal. That's not the norm though. Usually the market starts the new year out on a bullish foot for two to three trading days, and then drifts lower for the next ten to fifteen calendar days. Given how overbought the market will be starting the new year out, the odds of seeing stocks continue to outperform seem low. Again though, the market loves and lives to defy the odds. Assume nothing. Just know the tendencies.