Weekly Market Outlook - Will August Hinder The Market Rally?
Weekly Market Outlook - August 1, 2016
Though technically overbought and arguably overvalued, the market managed to hold its ground last week, and finish it knocking on the door of record highs. If the buyers pick up where they left off on Friday, we'll be at new record highs for the S&P 500 (SPX) (SPY) early this week.
Granted, a continued market runup without a pause or pullback would be a bit surprising at this point. Doing so would also defy an often seen calendar trend. More on that below.
We'll look at what could go wrong and what could go right for the market below, after a quick run-down of last week's and this week's major economic announcements.
Economic Data
Last week's biggie was obviously the second quarter's GDP report (the first of three, anyway). Rather than the anticipated growth rate of 2.4%, the economy only grew an estimated 1.2% during Q2. For the record, that number will be recalculated with more and better information two more times before an official tally is entered. The second and third calculation rarely waver much from the first one, however. What we've got is tepid second quarter growth, which prompted assumptions that the Federal Reserve will now even further postpone any impending rate hike.
GDP Growth Chart
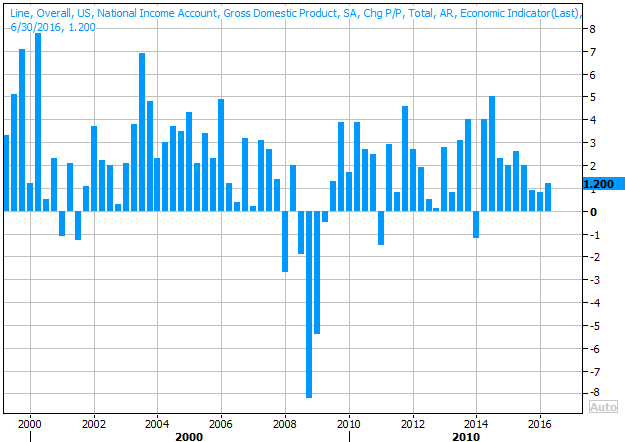
Source: Thomson Reuters
Of course, it's not as if the Fed was in a particular hurry anyway. While Wednesday's release of the FOMC interest rate decision indicated Janet Yellen and the other voting members were optimistic about the U.S. economy, the all-too-familiar rhetoric and decision to hold rates steady once again underscored what the GDP number ended up quantifying.
Last week was also a big one for consumer sentiment measures, with the Conference Board's consumer confidence score falling slightly from 98.0 to 97.3 in July, while the Michigan Sentiment Index fell from 95.0 to 90.0. Broadly speaking, consumer sentiment progress has leveled off for over a year now, and looks like it could go either way going forward.
Consumer Sentiment Chart
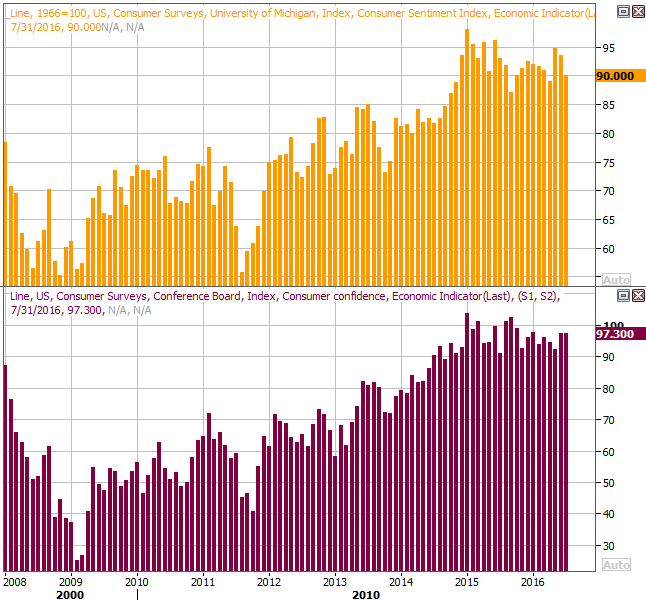
Source: Thomson Reuters
Finally, new home sales data for June rounded out the prior week's existing home sales number. As was the case with the latter, the former tiptoed deeper into multi-year high territory. The pace grew, on an annualized basis, from 551,000 to 592,000.
Home Sales Chart
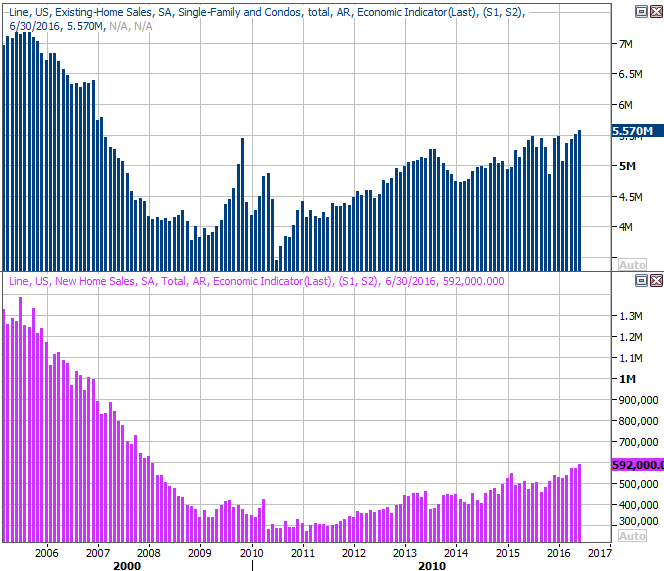
Source: Thomson Reuters
As we've said more than a few times now, while the overall economy may have some soft spots, real estate isn't one of them.
Everything else is on the following grid:
Economic Calendar
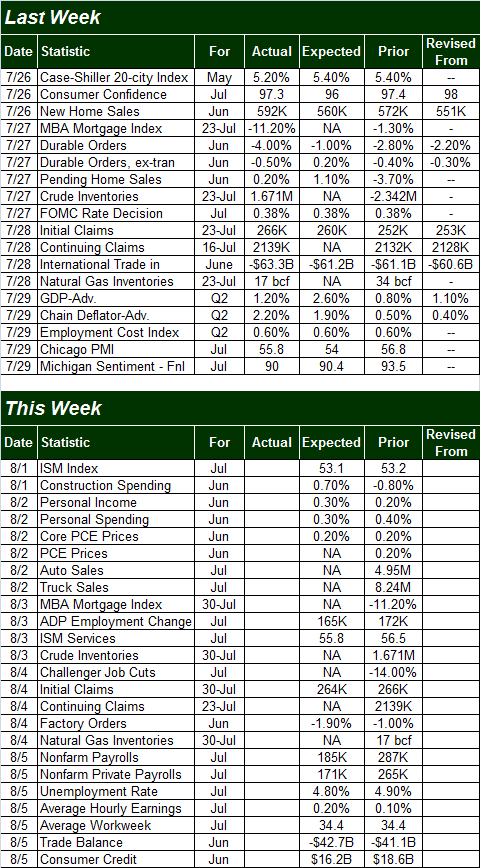
Source: Briefing.com
The coming week will be a another busy one in terms of economic news, though with only three highlights.
The first one will start to arrive on Monday.... the ISM index for July, followed by the release of the ISM Services Index on Wednesday. While both are expected to fall just a bit, each remains above the all-important 50 level.
ISM Indices Chart
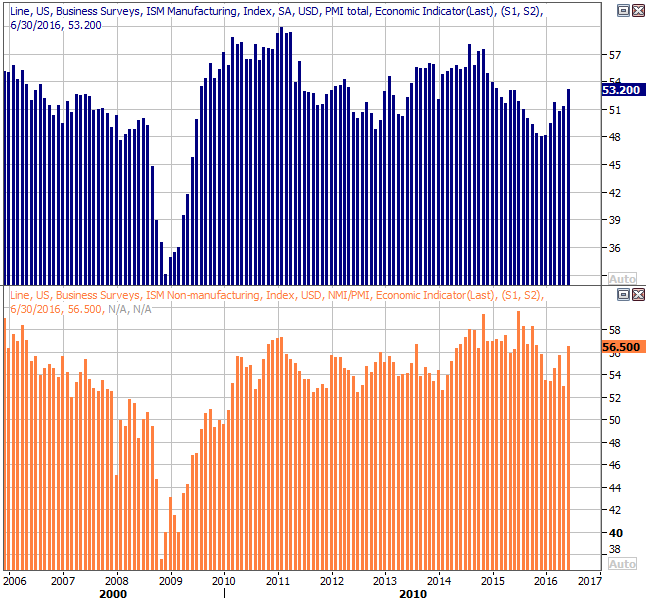
Source: Thomson Reuters
On Tuesday we'll hear last month's auto sales tally. Both car sales and truck sales have been generally trending lower since the late-2015 peak. Given the trajectory of both, if June's numbers don't show any material improvement it's more than cause for concern.
Auto Sales Chart
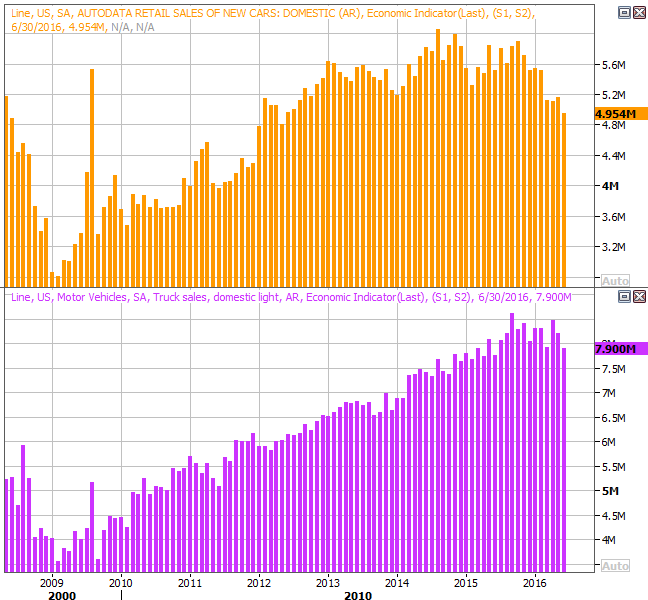
Source: Thomson Reuters
Last but not least, Friday's employment report for June has the potential to either knock the market off its perch or inspire yet another round of bullishness.
Economists are looking for the addition of 185,000 new jobs last month, which should be enough to push the unemployment rate down from 4.9% to 4.8%. Note, however, the total number of people employed seems to have plateaued right around 151,000,000, suggesting people are losing/leaving jobs just as quickly as they're finding them now. If that's a situation which becomes a trend, at that point the labor force participation rate and the employed/population ratio become critical indicators of employment progress (or lack thereof).
Employment, Job Growth Trend Chart
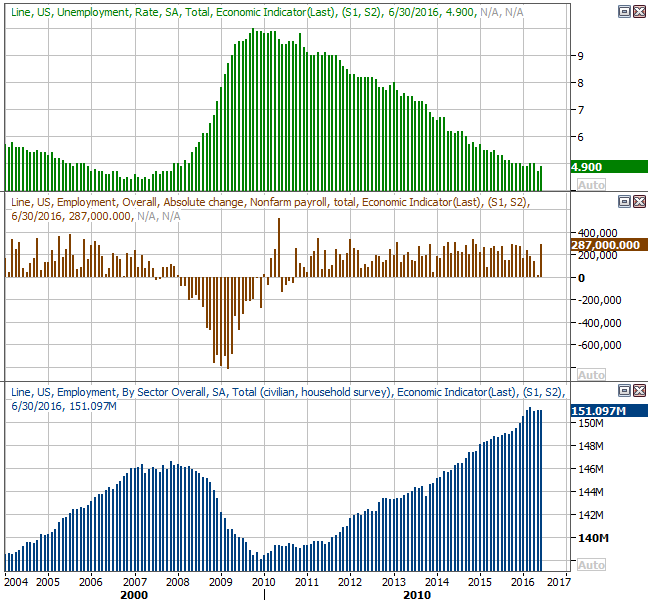
Source: Thomson Reuters
Stock Market Index Analysis
At another point in time and in another situation, it would be easy to be decidedly bullish given the shape of the current charts. The indices are testing the waters of higher highs, if they haven't already moved into new multi-year territory already. Momentum is incredible, even if a bit uneven. The overhang, however, is the distinct likelihood of profit-taking not just stemming from the 8% runup since June's lows, but from the broad market's frothy valuation. Investors are being forced to make tough decisions.
Thing is, knowing "the trend is your friend" forces traders to view the market in a bullish light at this time.
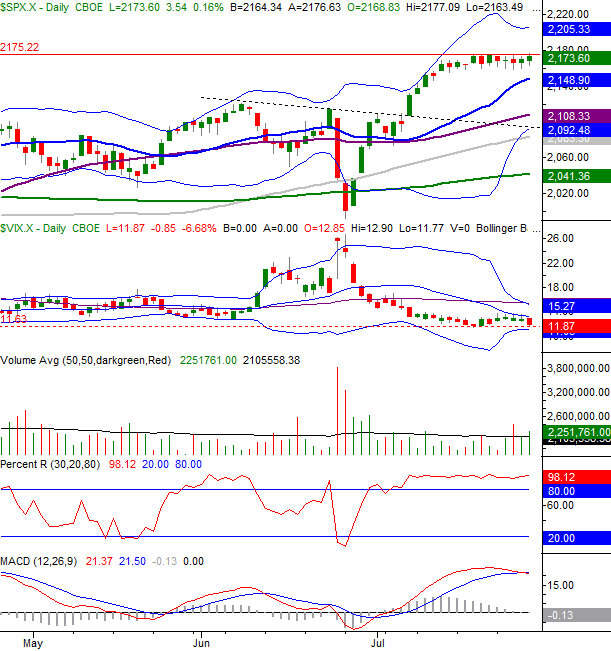
For the S&P 500, the key bullish clues are the fact that the buyers continue to test and put pressure on the ceiling around 2175 at the same time the CBOE Volatility Index (VIX) (VXX) continues to find ways to remain at unusually low levels (rather than bouncing up and off of them). Of particular interest is Friday's action, which is not only bullish in the sense that the index made a record intraday high, but that the volume behind the move was strong and above average. It's unusual to see that sort of buying interest on a Friday -- right in front of a weekend -- particularly when the future is so uncertain.
S&P 500 & VIX Daily Chart
Chart created with TradeStation
Should the S&P 500 clear the ceiling at 2175 that would technically constitute a breakout thrust and therefore be a bullish sign. Such a move would also be a company by a technical breakdown of the VIX. It may seem unlikely, but that is the setup, and as was noted, the bulls have the edge because they have momentum.
Zooming out to a weekly chart of the S&P 500 we can get a better feel for just how unusual the past five weeks as well as the past five months have been for stocks. It's also in this timeframe we can see the VIX is at something of an absolute floor. Here's the thing about the VIX.... it can linger at these low levels while the bulls continue to chug along.
S&P 500 & VIX Weekly Chart
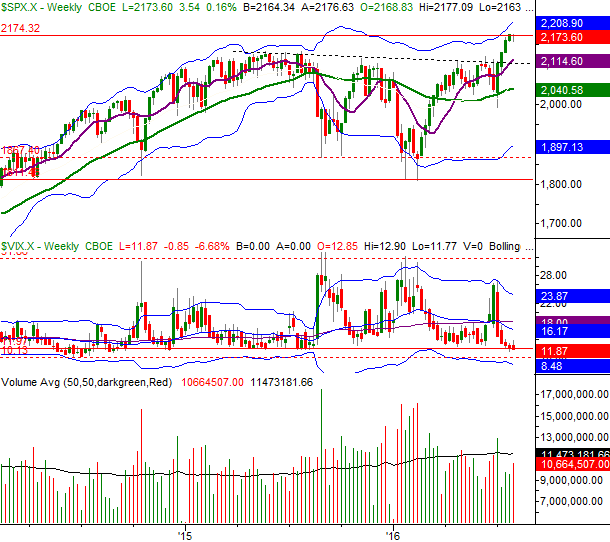
Chart created with TradeStation
Nevertheless, it's pretty clear the S&P 500 has gotten about as far removed from its mean, or average, as it historically gets.
Interestingly, the NASDAQ Composite (COMP) doesn't appear as if it's hitting the same headwind, nor does the NASDAQ seem to be as ready to roll over as the S&P 500.
Take a look. The composite has now logged five solid weekly gains in a row, and yet has still not rivaled its 2015 peak. It has bumped into its late-2015 highs, which is where its upper 26-week Bollinger band also lies. If the bears were going to make a stand, this would be an ideal place to make it happen. All the same, with room for the Nasdaq Volatility Index (VXN) to move a little lower and with the NASDAQ's buying volume picking up steam (not to mention the fact that the NASDAQ Composite doesn't have to cut into new-high territory yet), the bullish case isn't a bad one.
NASDAQ Composite & VXN Weekly Chart
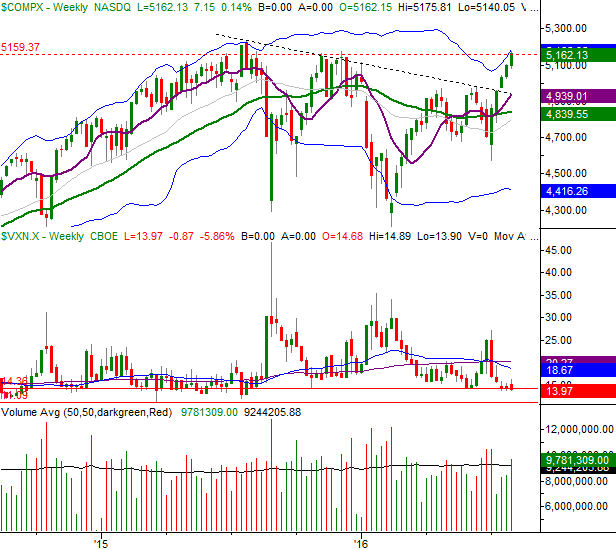
Chart created with TradeStation
Perhaps the worst thing going for stocks right now isn't so much the technical situation or even the questionable fundamentals. Rather, the biggest headwind stocks could be facing at this time is the calendar.
While there's always proverbially "more to the story," August usually isn't a great month for stocks.
Over the past 65 years, the average August return for the S&P 500 is -0.27%. Granted, the market makes a gain of any size an average of 57% of the time in August, which means it only loses ground 43% of the time for the month. When it does lose ground though, it usually loses ground in spades. The average August loss? It's on the order of -4.24%. The market is also net down over Augusts since 2009.
With the market up already well above its average return through July this particular year, one can't help but wonder if August of 2016 is going to dish out a sizeable pullback just to return stocks to their historical year-to-date averages.
Analysts Only Lukewarm On Future Market
Last but not least, Reuters' quarterly polls of analysts on where key market indices are going has finally been updated for July. On the chart below, the high, low, and median expectations have been plotted for the end of this year as well as for the middle of next year. As you'll see, while earnings are expected to grow (earnings projections not shown on this particular chart) through mid-2017, the professionals think that growth is mostly already priced into the indices' values. [Some analysts are clearly calling for major direction, but those outlooks are the minority.]
S&P 500 Price Projection Chart
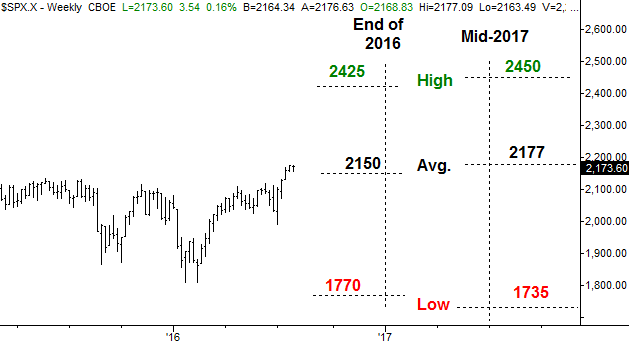
Source: Thomson Reuters
The estimates change every quarter and could be altered significantly between now and the end of next year. But, there's a reason so many pros feel the way they do.... including feeling unenthused. For what it's worth the, the high-low range of the outlooks is wider than usual.
While the broad market may just be a so-so performer for the next year, that doesn't mean certain stocks and certain sectors or industry's won't move relatively more than the overall market does. Pick and choose your hot spots.
Trade Well,
Price Headley
BigTrends.com
1-800-244-8736