Weekly Market Outlook - We Ended the Week on a Low Note, But...
The market spent the better part of the week right at breakeven levels. But, when push came to shove on Friday and traders had to make a commitment, they chose to be out rather than in. Friday's 0.49% setback for the S&P 500 was essentially the loss for the week.
It's possible Friday's triple-watching expiration of monthly as well as quarterly futures and options sparked the weakness, and that's certainly what sparked the volume surge. That, however, is also what makes the whole day a bit suspicious. We still have to start this week where we left off last week -- which isn't in great shape -- but there's no clear clue about what traders are actually thinking here.
On the flipside, this is traditionally a tough time of year for stocks.
We'll weigh it all below, after recapping last week's most important economic announcements and previewing this week's economic news.
Economic Data Analysis
A fairly busy week last week in terms of economic news, with the biggest news of course being the decision in the middle of it to cut interest rates. The Fed Funds Target Rate was lowered by a quarter of a point, to a targeted range of between 1.75% and 2.0%. Not all investors or analysts are convinced the economy needed that boost, though it likely can't do harm.
But, first things first. On Tuesday we heard what was arguably more important data for the stock market -- last month's industrial output and utilization of our factories' production capacity. Both were up (rather firmly) versus expectations ... a much-needed signal that the economy is doing well enough to prod industrial earnings upward.
Capacity Utilization and Industrial Production Charts
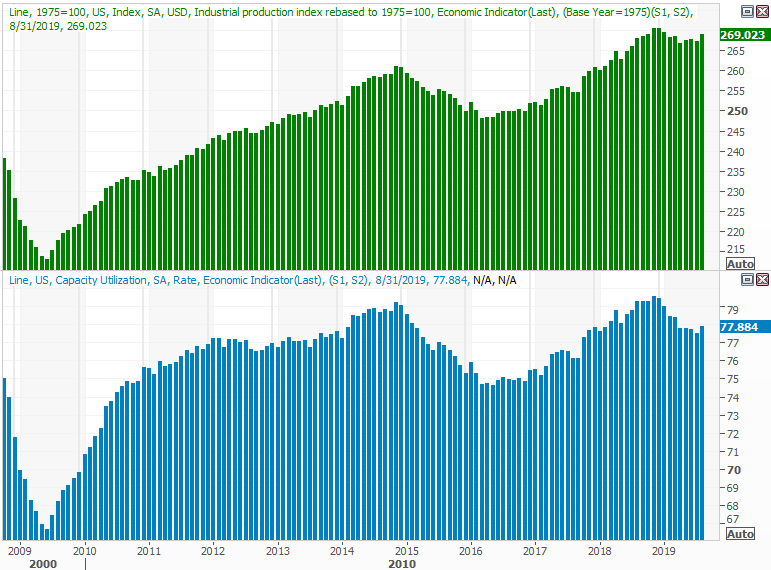
Source: Thomson Reuters
On Wednesday, aside from the rate cut, we also got another piece of encouraging information that was obscured by bigger headlines. That is, housing starts and building permits both surged, suggesting recent near-record lows in borrowing rates prompted new demand for home purchases, In fact, each measure moved to their highest reading since 2007, when both were on the way down.
Housing Starts and Building Permits Charts

Source: Thomson Reuters
To that end, sales of existing homes did indeed improve ... not as dramatically, but certainly measurably. Better still, last month marked the second straight month of progress, and the fourth in the past five. Also notice that inventory levels are being whittled away.
New, Existing Home Sales Charts
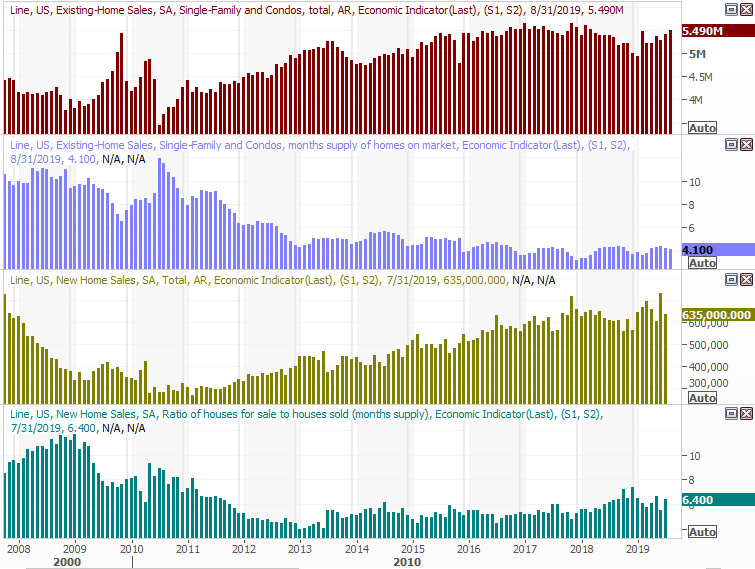
Source: Thomson Reuters
We won't get August's new-home sales data until Wednesday of this week. But, economists are expecting similar growth... and they're probably underestimating that progress.
Everything else is on the grid.
Economic Calendar
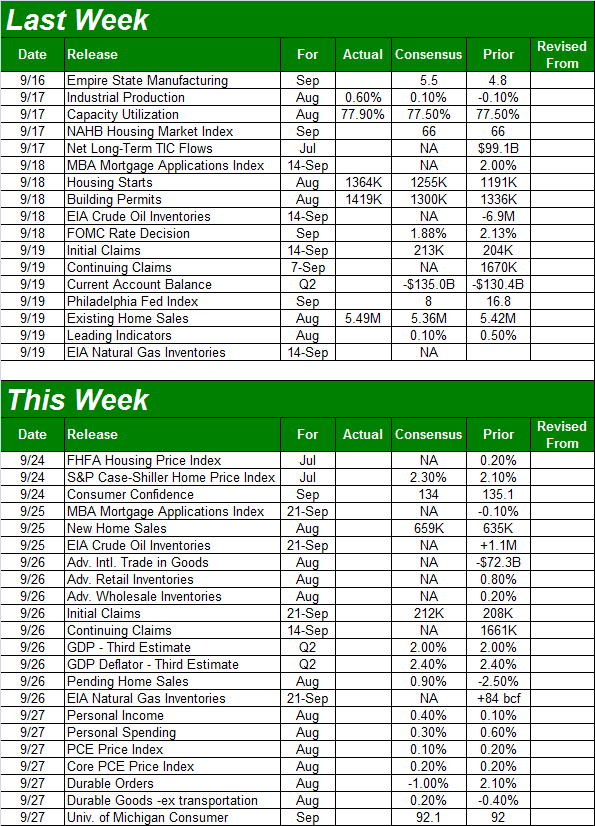
Source: Briefing.com
This week is set to be a pretty busy one again, kicking off with a look at home prices... although only through July, which means they won't reflect the newfound demand that took shape last month. Even so, the pros are calling for more progress, even if at the slower growth pace we've seen in recent months.
Home Price Charts
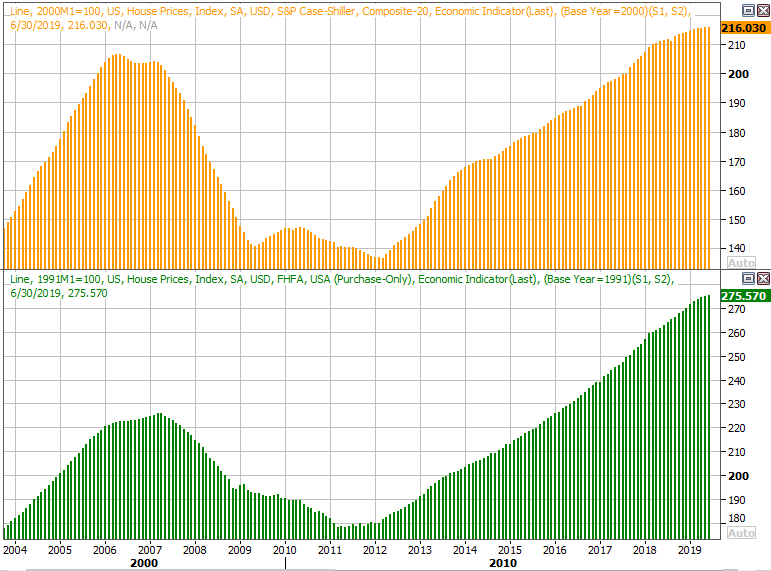
Source: Thomson Reuters
We're also going to get the Conference Board's look at consumer confidence on Tuesday. You may recall it popped higher a month ago... a move not mirrored by the Michigan Sentiment Index, last month or this month. Economists are looking for a slight lull this time around, though even at a reading of 134, sentiment will remain pretty strong.
Consumer Sentiment Charts

Source: Thomson Reuters
Again, on Wednesday we'll hear August's new-home sales number. The really big number we want to keep an eye on this week, however, is Thursday's third and last big look at Q2's GDP growth figure. Economists don't expect it to waver from the second guess of 2.0%, but it would be nice to be sure.
GDP Growth Charts
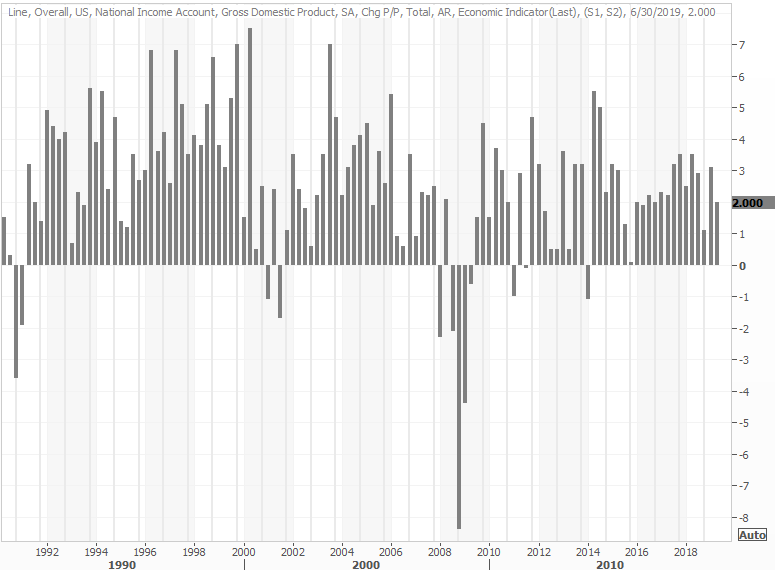
Source: Thomson Reuters
Stock Market Index Analysis
Don't be too quick to jump to any conclusions about Friday's high volume lull. It was a major options expiration day, which can skew market action, and draw out tons of trading volume.
On the other hand, sometimes futures and options expiration days force traders to play the hand they're really holding. Or, in this case, perhaps the mass expiration of options and futures forced traders to lean in the bearish direction they were already thinking about leaning in anyway.
The calendar is certainly working against the market in any case. This is a tough time of year for stocks, usually through the early part of October. In the third year of a presidential term, on average, stocks are weak through the middle of November, once the midterm elections are over.
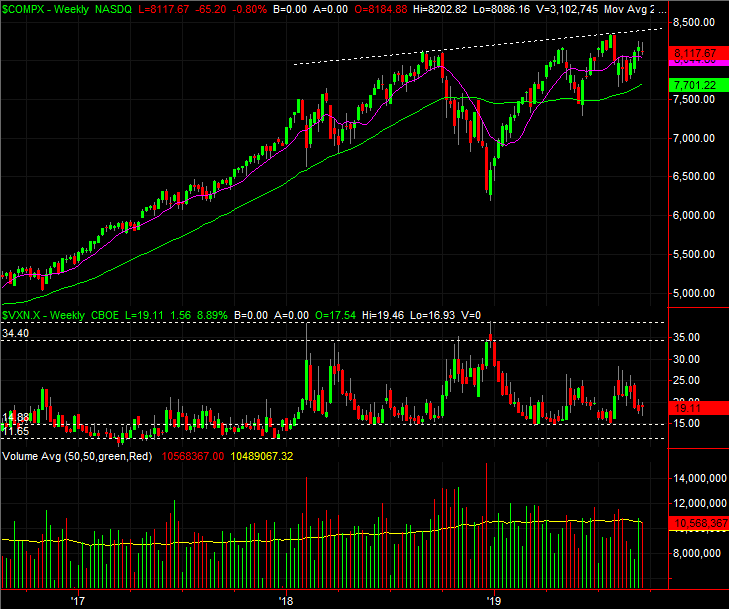
To that end, we'll start this week's analysis with a weekly chart of the S&P 500, as the bigger-picture timeframe is the one that's more important at this time; the impact of expiration day won't last more than a couple of days.
That's the gentle way of pointing out that even if the bearish pressure is eased up this week, there's still a long-term technical ceiling in play, plotted as a dashed white line on the graph.
S&P 500 Weekly Chart, with VIX, Volume
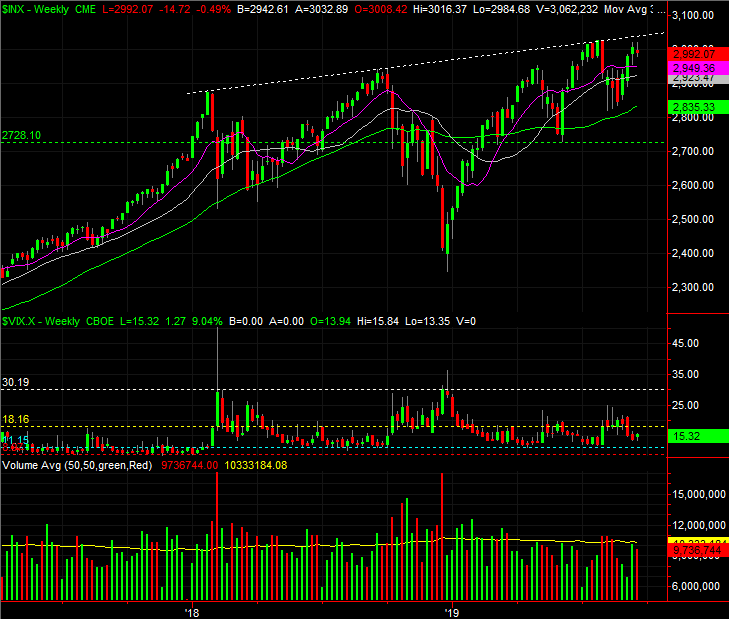
Source: TradeStation
Ditto, more or less, for the weekly chart of the NASDAQ Composite.
NASDAQ Composite Weekly Chart, with VIX, Volume
Source: TradeStation
Take note of the fact that on both weekly charts, their respective volatility indexes remain at the low end of their range. That's a clue that Friday's wave of option expiration wasn't that dramatic. Indirectly, it says there's still room for a lot more downside ... IF the bears can just get that ball rolling. With the prospect of an amicable end to the tariff war though, not too many traders are willing to bet against stocks. That's keeping the market propped up, which in fact is the one key thing keeping everyone only guessing as to what lies ahead.
To that end, also notice that both weekly charts more or less have an upside-down head-and-shoulders shape to them, which sets the stage for upside IF the neckliines -- the dashed resistance line -- can be hurdled.
That's what makes the daily charts so important to watch right now... with the broad market on the fence and capable of moving in either direction, investors need to watch closely to spot the points where the indices break out or break down. For the S&P 500, the breakout line is just under 3050, though a breakdown would involve falling under several technical floors all the way down to the 200-day moving average line (green) at 2825. There's also something like support around 2730, where the S&P 500 bottomed a couple of different times earlier in the year.
S&P 500 Daily Chart, with VIX, Volume
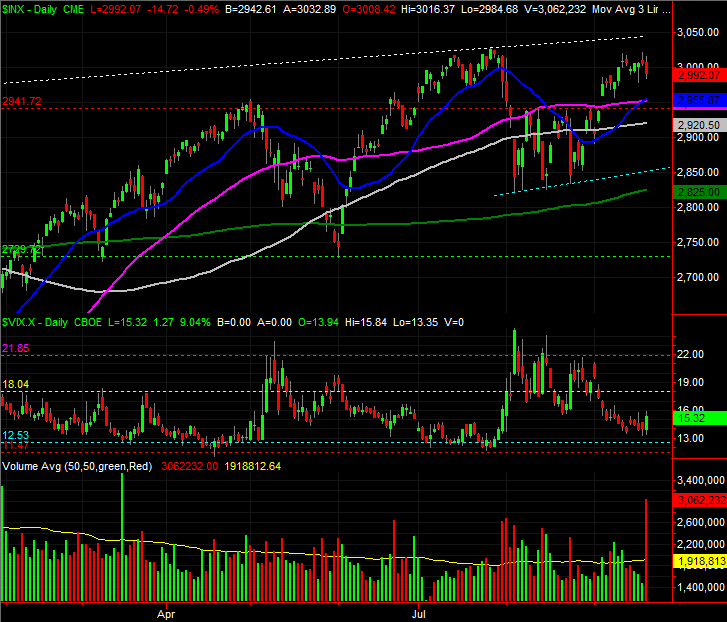
Source: TradeStation
The smart-money move to make here is to do nothing... yet. They're not showing it. They may not even know it. But, traders are very much on the fence here. A major move has been postponed for a while now, but can't be put on hold forever. That move is just as likely to be bullish or bearish.
One final matter to absorb, however... don't assume a bullish thrust is going to last a while. A good move could easily be a blowoff top, and the beginning of a 'sell the news' event. The most likely news to drive a move to the peak is a step to the end of the trade war.