Weekly Market Outlook - Toying With Technical Support
Stocks may have wobbled late last week, but at least they held their ground. That's something. Unfortunately, it didn't do them a whole lot of good. Tuesday's strong selloff wasn't undone, and that was enough to leave the S&P 500 under the pivotal 20-day moving average line for the week. Indeed, the index is within striking distance of a much bigger support level... and traders are struggling to find more reasons to keep the market propped up.
We'll weigh the odds and gauge the momentum below, as we always do. Before we get into the technical analysis though, let's paint some broad brush strokes with this week's and next week's economic numbers.
Economic Data
It would have been easy to not notice in, as it was overshadowed by all the political rhetoric (and political grandstanding), but last week was actually rather busy in terms of economic news. Much of it was more important than not too. We'll just dive in so we can get through it quickly, starting with durable orders.
Bad news on that front, by the way. Analysts were expecting a fairly tepid showing, and we couldn't even clear those low hurdles. Overall orders were down 1.1% -- thanks to a lull in transportation orders -- but even taking planes, trains and automobiles out the equation we still only saw a 0.1% improvement. The pros were calling for 0.3% growth.
Durable Orders Charts
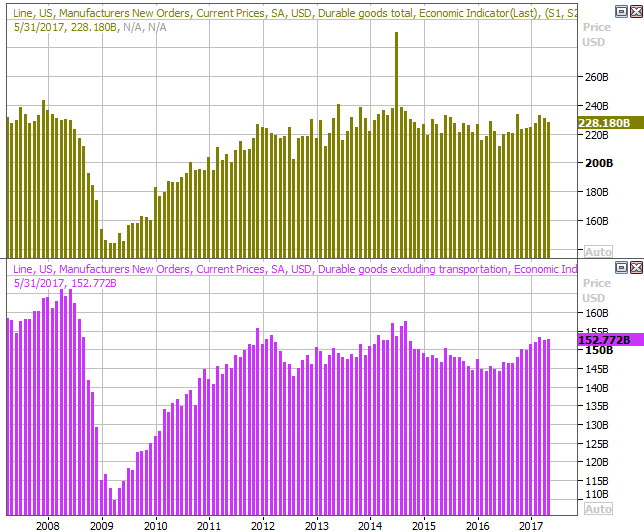
Source: Thomson Reuters
It's a little too soon to sound the alarm bell yet, but it looks like orders are stagnating.
We also got the Case-Shiller home price report for April last week, rounding out the FHFA home price report from a couple of weeks back. Another big step forward, even if not as much as expected.
Case-Shiller and FHFA Home Price Charts
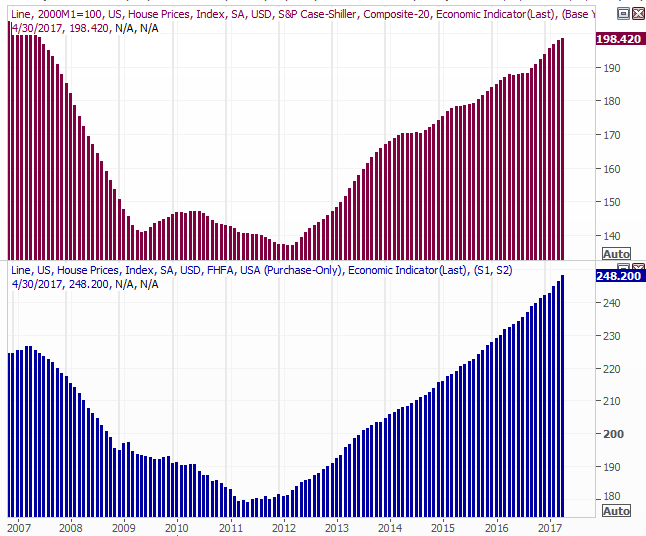
Source: Thomson Reuters
Home prices aren't a problem, even if a lack of home sales is.
It was also a big week for consumer sentiment data, with the Conference Board's consumer confidence score for June being posted on Tuesday, and the third (and final) Michigan Sentiment Index score being reported on Friday. Both were up despite geopolitical reasons for concern, suggesting the nation's spenders feel good enough about the country's economic prospects that we'll push through any problems. As long as consumers are feeling good, they'll spend accordingly. To that end, incomes were up 0.4% last month, rolling in a bit higher than expected. Spending was up the expected 0.1%. (We still need businesses to follow suit though, for the economy to achieve escape velocity.)
Consumer Sentiment Charts

Source: Thomson Reuters
It's not a chart we would normally look at, but since crude oil inventories have been such a hot button of late we'll continue to keep tabs on it for you. Unfortunately if you're betting on crude prices to rise, last week's news wasn't great. Analysts were expecting inventory levels to resume a bigger-picture pullback, but they edged up just a notch. It still broadly looks like we're whittling down the glut, but it's an anything-but-convincing
Crude Oil Inventory Charts
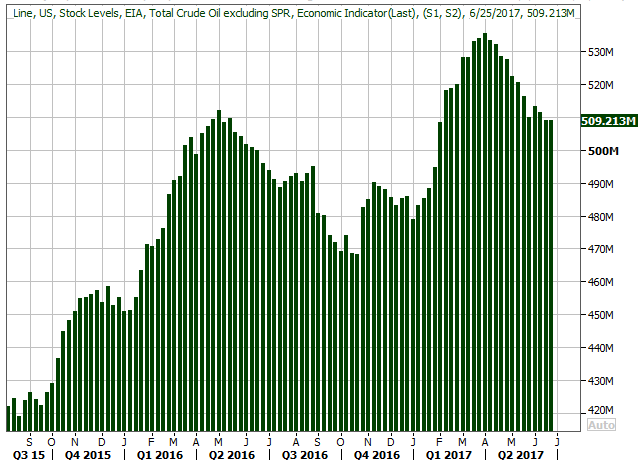
Source: Thomson Reuters
Finally, a last look at Q1's estimated GDP growth. The final adjustment was pushed up from a second reading of 1.2% to a growth rate of 1.4%... a pretty big adjustment for that particular data. It's still rather anemic overall though. Until we can start seeing regular reading of 2% (and ideally, 3%), we're just not going to see the kinds of earnings growth we need to see to light a real fire under stocks... and justify their current frothy valuations.
GDP Growth Charts
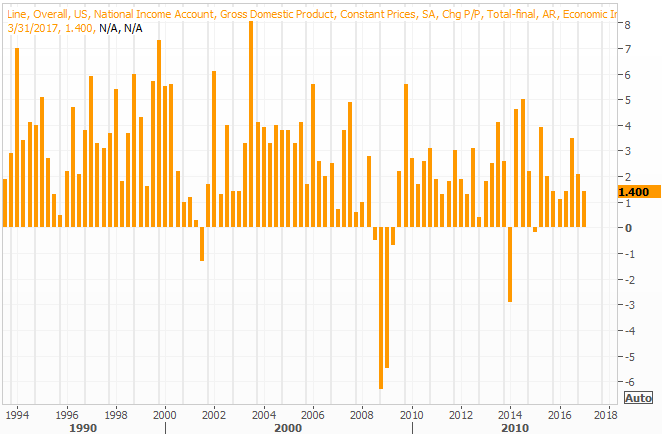
Source: Thomson Reuters
Everything else is on the grid.
Economic Calendar
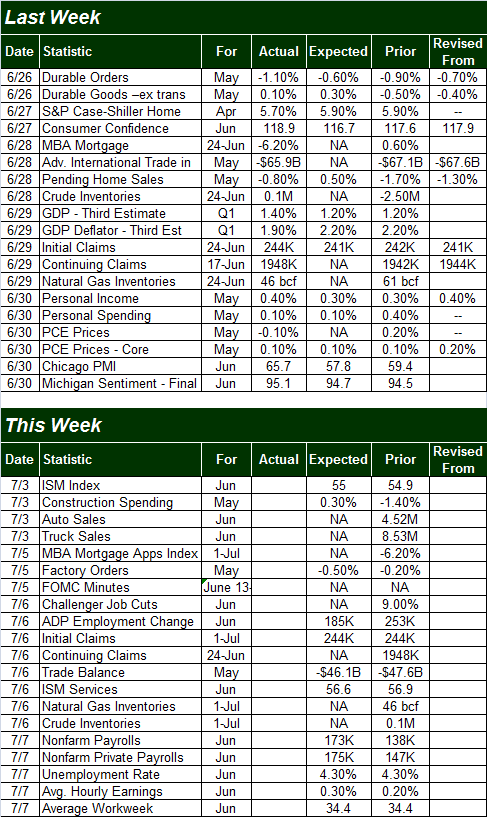
Source: Briefing.com
This week isn't going to be any less busy, though we're trying to cram the same amount of data into a holiday-shortened trading week due to the July 4th holiday. [The market is closed on Tuesday, but also only open a half day on Monday.]
The party starts on Monday with June's ISM Manufacturing Index reading, though its service's counterpart will be unveiled on Thursday. Economists are looking for more of the same this week, which isn't bad, but not exactly good either. Manufacturing fell three months ago, and hasn't recovered, while services has been stagnant.
ISM Index Charts
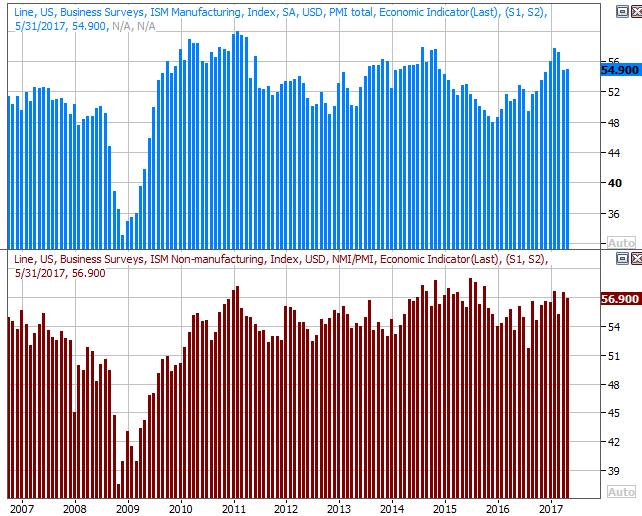
Source: Thomson Reuters
Still, as long as both ISM readings are above 50, it's a positive.
Also on Monday -- over the course of the day -- we'll be hearing last month's auto sales figures. They've been deteriorating for a while now, and the industry experts are forecasting a 2% decline for the month's activity. This has turned into a full-blown trend. Even truck sales are cooling off.
Auto Sales Charts

Source: Thomson Reuters
The big Kahuna this week, of course, is last month's employment report. The pros aren't calling for much in the way of net progress; the unemployment rate should hold steady at 4.3%, on the heels of 173,000 new payrolls. Then again, there's not a lot of room for job additions. The litmus test for an improved job market will come in the form of better income, which economists believe were up a healthy 0.3% in June (with the workweek holding steady at 34.4 hours).
Unemployment Rate, Payroll Growth Charts
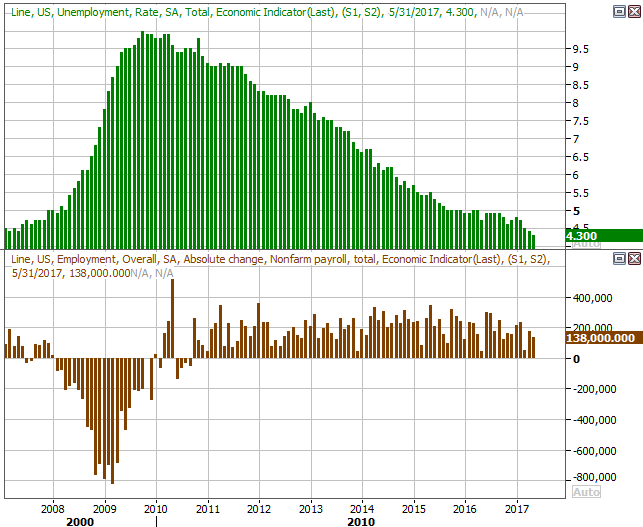
Source: Thomson Reuters
Index Analysis
To be clear, the market is still standing up, holding itself above some key technical floors. But, it's hanging by thread, moving into that support... and this time with a little more bearish breadth and depth than we've normally seen of late.
The daily chart of the S&P 500 makes this pretty clear. The index lost ground last week, falling under the 20-day moving average line in the process. Yes, it popped after merely brushing the 50-day moving average line (purple) on Thursday. There was no follow-through though, and as of Friday the S&P 500 looked like it was going to test the 50-day moving average line as a floor again.
S&P 500 Daily Chart
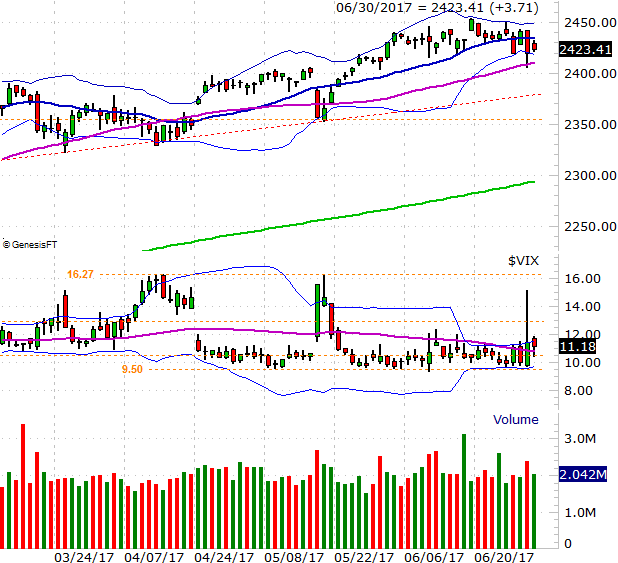
Chart created with TradeNavigator
Also note that the VIX is starting to edge higher here, moving up and into (and above) its upper Bollinger band. The scariest part about the VIX right now is that it's just moving upward at a slow, measured pace. When the VIX spikes, that usually sets up a bounce. If the VIX is just trending higher, it means it's not a panic selling, but a well-reasoned one. Those are the kinds of selloffs that can last a while.
Still, until the VIX makes its way above 13.0 -- and really, above 16.3 -- we can't assume any weakness is going anywhere. The S&P 500 needs to break below a rising support line currently at 2378 before we can start to fear the worst, and we don't need to fear the actual worst until the index moves under its May low of 2354.
Unfortunately, the tech-heavy NASDAQ isn't holding up quite as well. It closed below its 50-day moving average line on Friday, and is within striking distance of a huge support level at 6102. Under that mark, and there's nothing to hold the composite up until we get to the 5787 area. The 200-day moving average line (green) will be somewhere around there by the time it could be tested.
NASDAQ Composite Daily Chart
Chart created with TradeNavigator
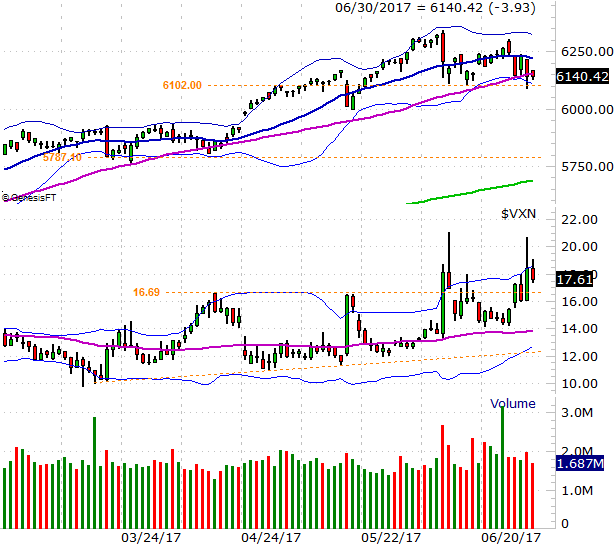
Zooming out to a weekly chart of either index doesn't tell us something we don't already know. But, this view of the NASDAQ Composite does put things in perspective about how far the market has come since early 2016 without a (much-needed) correction. It's also in this timeframe we can see how close the VXN is to breaking above a major ceiling... and there's plenty of room for the VXN to keep rising before it bumps into a major ceiling. The composite could and likely would slide lower while the VIX is getting to that ceiling.
NASDAQ Composite Weekly Chart
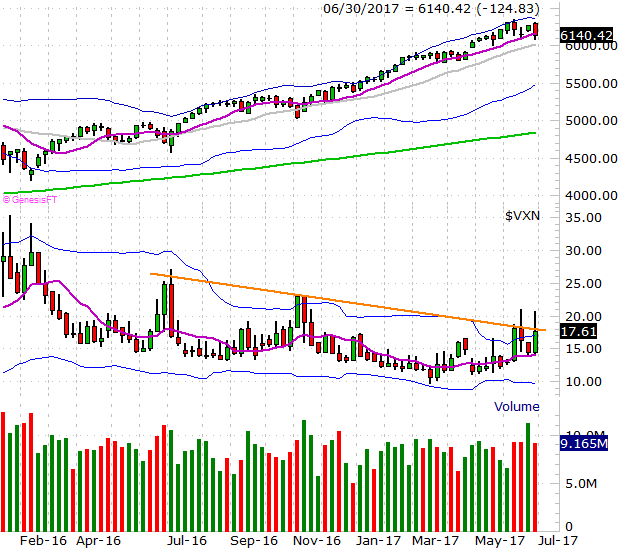
Chart created with TradeNavigator
As is always the case though, it's better to trade what the market IS doing rather than what one thinks it should be doing. For the time being, vulnerable though they may be, stocks are still in a technical uptrend.