

Picking up where they left off the prior week, the bulls logged another win, carrying stocks to yet-another record level. The S&P 500 advanced to the tune of 1.7% for the four-day, holiday-shortened stretch. The NASDAQ jumped 1.6%, also reaching a new high in the process.
That still doesn’t mean the market is destined to continue marching higher from here, adding to its gains. Indeed, there’s (still) room and reason for a quick profit-taking pullback. Even if we get it though, that’s not necessarily going to be the beginning of a prolonged pullback. It will just be enough correction to bleed off some of the bullish pressure.
We’ll take a detailed look at the situation after looking at last week’s top economic reports.
Economic Data Analysis
The party started in earnest on Tuesday with a look at the Institute of Supply Management’s measure of manufacturing activity for June. We ended up getting more of an improvement than anticipated, but at 49%, the number is still below the pivotal 50 mark. On Wednesday we heard the ISM Services Index figure for June. It climbed slightly, but the improvement to 50.8% is a shift from net-negative to net positive.
ISM Services, Manufacturing Index Charts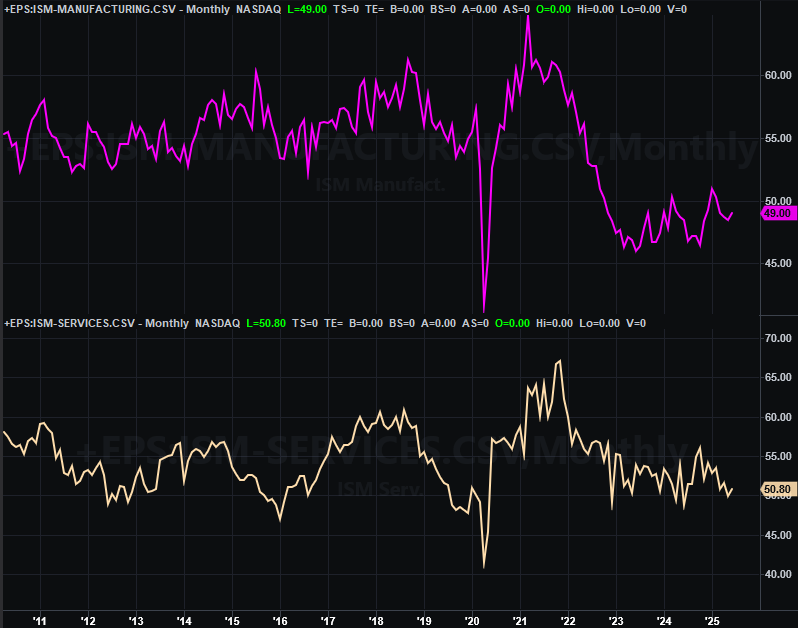
Source: Institute of Supply Management, TradeStation
In both cases the ISM’s economic barometers are most inconclusive, unable to start a long-lived trend in either direction.
The only other data release of any interest last week was a big one… last month’s unemployment rate and payroll growth figure. Following the alarming ADP report from earlier in the week suggesting a sizeable number of job losses, traders were understandably concerned heading into Thursday morning. They didn’t need to be though. In contrast with ADP’s count, the Department of Labor says we actually added 147,000 new (net) payrolls in June, which was enough to drag the unemployment rate down to 4.1%. (The size of the labor force shrunk somewhat last month, but that was still matched by an increase in the total number of employed individuals.)
Unemployment Rate, Payroll Growth Charts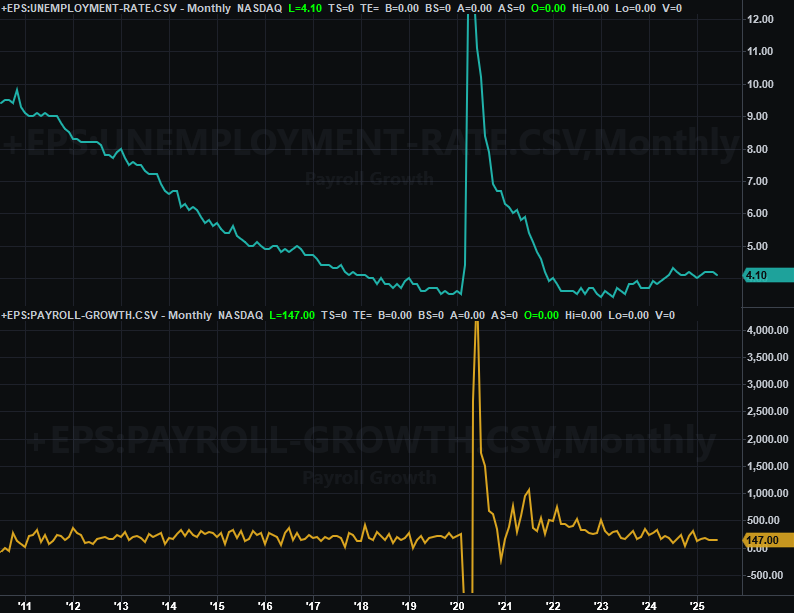
Source: Bureau of Labor Statistics, TradeStation
Everything else is on the grid.
Economic Data Report Calendar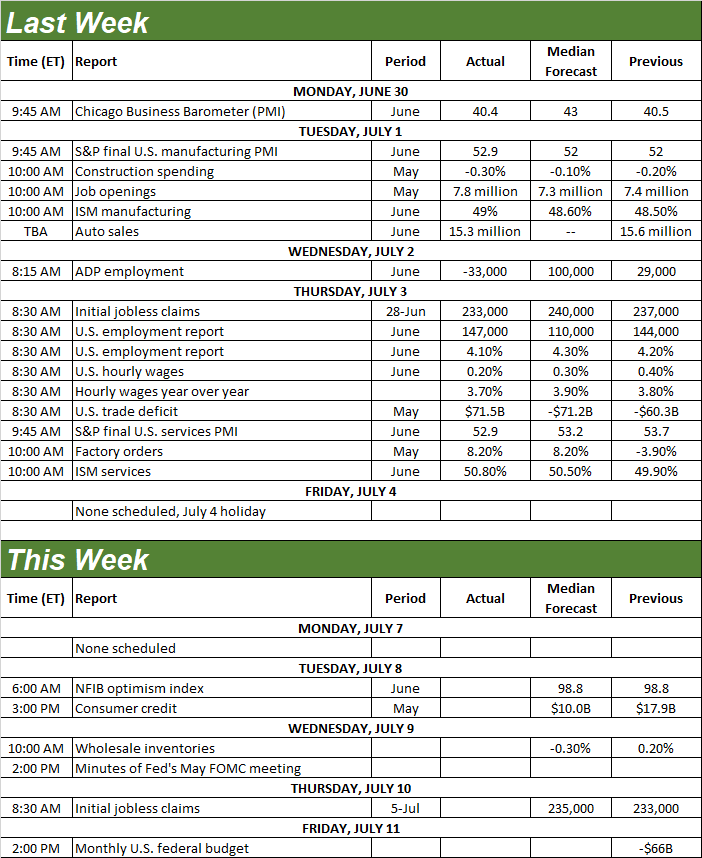
Source: Briefing.com, TradeStation
There’s not a lot in the lineup for this week, and nothing worth showing a preview chart for. The only item of interest might be Wednesday’s release of the minutes from the Federal Reserve’s open market committee in May. It might offer up some insight as to how the FOMC is seeing things right now, interest rate-wise. But, so much has happened in the meantime that it also doesn’t mean much anymore. Whatever the case, the market’s now betting there’s a 68% chance of at least a quarter-point rate cut in September, but there’s no chance we’ll see one when the Fed has a scheduled opportunity to change the Fed Funds Rate later this month.
Stock Market Index Analysis
The daily chart of the S&P 500 below says it all. Despite a somewhat slow start, the index perked up later in the week (following the previous week’s close at a record) to move to yet-another record-high close. The move silenced most of any naysayers that thought the prior week’s bullishness was just a fluke.
S&P 500 Daily Chart, with VIX and Volume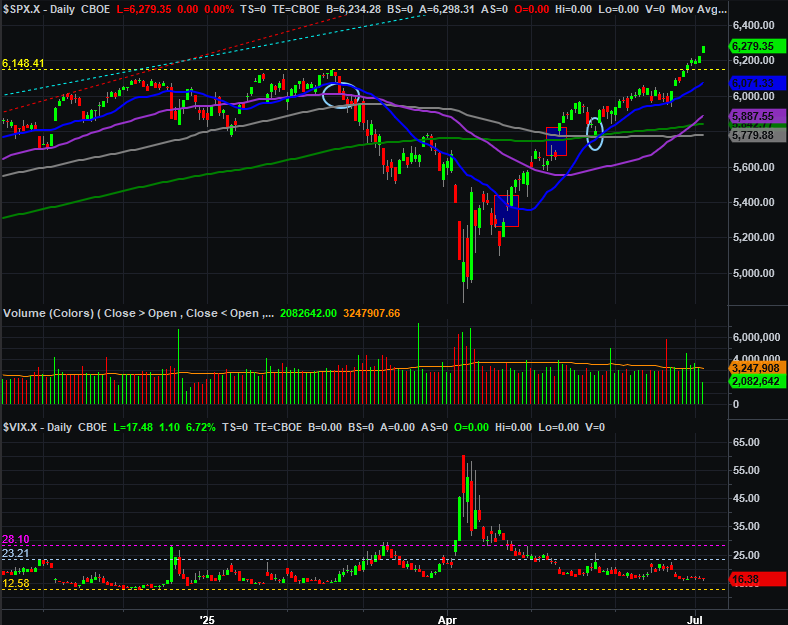
Source: TradeNavigator
That doesn’t necessarily guarantee the market’s going to keep charging higher. The S&P 500 now sits 7.5% above its 200-day moving average line (green) at 5,846 thanks to last week’s 1.7%. That’s a pretty wide divergence. So, it’s pretty overextended as is, and ripe for some profit-taking. The volatility index (or VIX) is also hovering what’s – for all intents and purposes – an established technical floor around 12.6. This doesn’t say a pullback is imminent, but it certainly makes it tougher for stocks to keep climbing. Trade volume was also fading as last week’s buying continued heading into the weekend. Then again, you’d expect to see participation fade headed into a three-day holiday weekend.
The real worry here, however, is only put into its full proper perspective with a weekly chart of the S&P 500. It’s from this vantage points that you can see how far it’s come just since April’s low. That’s a 30% runup in just 13 weeks… one of the biggest/fastest gains in years.
S&P 500 Weekly Chart, with VIX 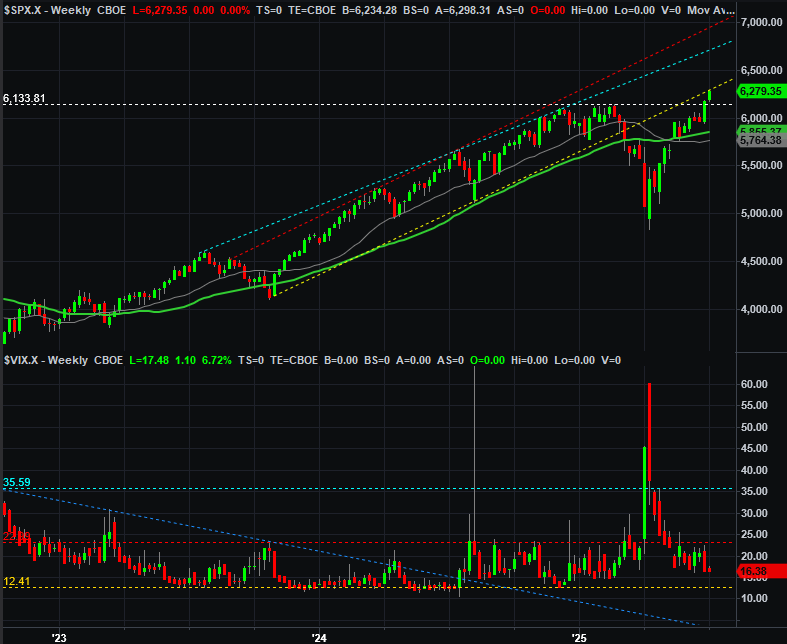
Source: TradeNavigator
Granted, that big jump also followed what was one of the biggest and fastest meltdowns we’ve seen in years. So, it wasn’t like the market didn’t have a bit of an advantage headed into the recovery. Still…
Perhaps the biggest thing to notice on the weekly chart of the S&P 500, however, is that even with the enormous rally, the index still isn’t back inside the bullish trading range that has been steering it upward since 2023. There’s room for it to continue moving higher without actually doing anything unusual. The question is just one of pacing, and figuring out how to cool itself off on the way up rather than overheating and subsequently starting a more serious selloff.
To this end, let’s assume the 200-day moving average line converged with the 50-day (purple) and 100-day (gray) moving average lines around 5,800 is the technical line in the sand, should a corrective move take shape.
Here’s the weekly chart of the NASDAQ Composite, by the way. It looks about the same as the S&P 500’s but there is one noteworthy nuance worth highlighting here. That’s the fact that it is back in the middle of the rising bullish channel that had framed its long-term rally beginning back in 2023.
NASDAQ Composite Weekly Chart, with VXN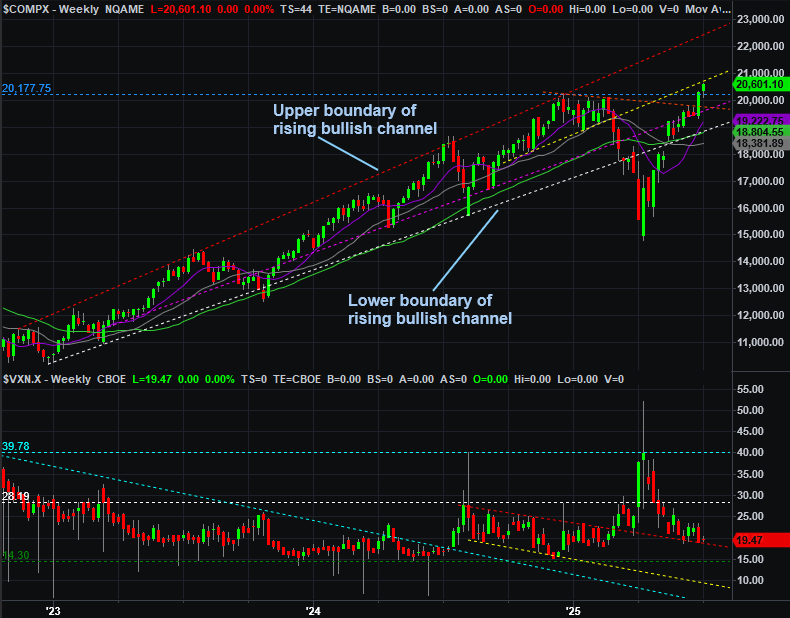
Source: TradeNavigator
So what now? Let’s assume the bears and would-be profit-takers are going to push back on this effort. It’s just too much to pass up. But, let’s also not panic if-and-when it happens. There’s still plenty of technical support below to bring a quick end to any selling. Indeed, it might actually be a good think to burn off some of this tension first before proceeding higher.
Just bear in mind that stocks are hypersensitive to headlines right now. Traders have pushed stocks up to extreme valuations that don’t last without some obvious and undeniable evidence that companies will earn their way into these valuations. If there’s any inkling that they may not be able to do so, the market could easily change its mind in a hurry.
Let’s just not over-anticipate that possibility either, though. The signs should be there pretty early on of that’s what’s in the cards. As was noted, for instance, the S&P 500’s got a thick back of technical support around 5,800.