Weekly Market Outlook – To the Brink, But Not Past It

The bulls answered the call last week, pushing firmly back against the prior week’s rout. That is, the previous week’s 3.0% tumble, the S&P 500 bounced 2.7% last week. It’s a much-needed glimmer of hope.
Just don’t grow too hopeful too soon. For all the effort, the market didn’t actually snap the selloff that began four weeks back. Last week’s gain may only be a dead-cat bounce, ready to yield to the sellers again. We’ll show you why in a moment. Let’s first run through last week’s biggest economic reports and then look at what’s coming this week.
Spoiler alert: Hopes for a rate cut in the near future continue to fade.
Economic Data Analysis
After hearing March’s existing home-sales numbers a week earlier, last week we heard last month’s new home sales. The annualized pace of 693,000 is a healthy improvement on February’s figure. That’s in contrast with the dip in March’s sales of existing homes, but more than that, new home sales may be ticking higher specifically because sales of existing homes are down -- folks aren’t selling. (As a reminder, at 1.11 million homes for sale, inventory of existing homes remains near multi-year lows. For perspective, inventory levels were twice that in 2015.
New and Existing Home Sales Charts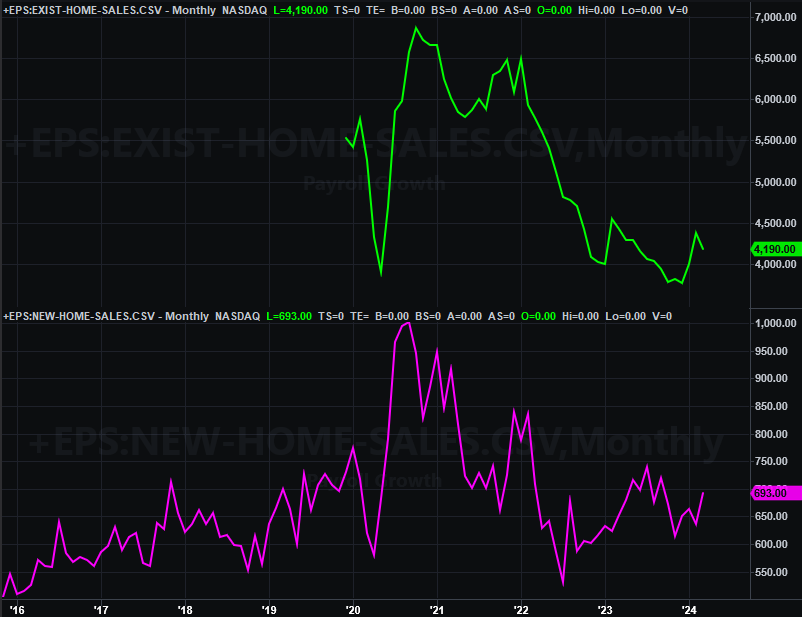
Source: National Association of Realtors, Census Bureau, TradeStation
We also got the third and final reading of the University of Michigan’s consumer sentiment index for April. It fell a bit, but is holding on to its surge from January.
Consumer Sentiment Charts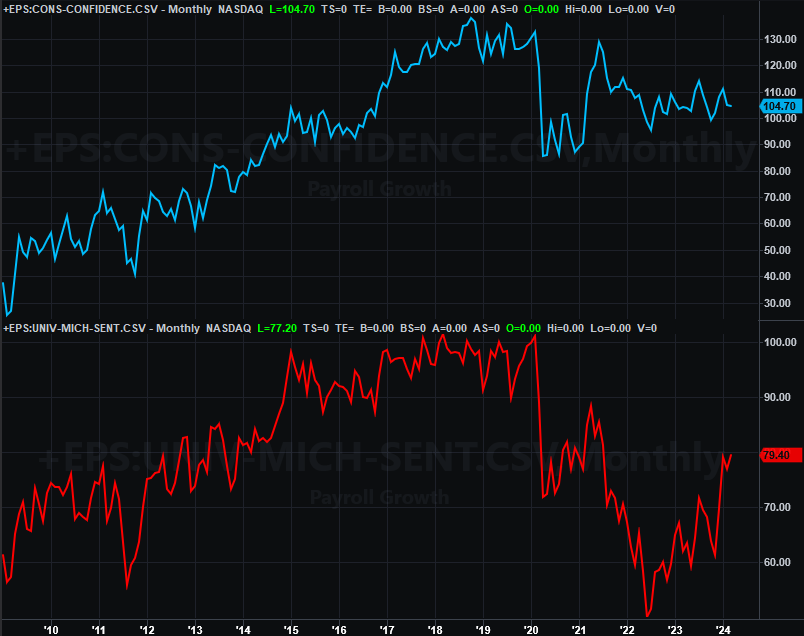
Source: University of Michigan, Conference Board, TradeStation
The Conference Board’s consumer sentiment number for April will be posted on Tuesday of this week. It’s expected to peel back just a little bit as well.
Last week’s biggest news, however, isn’t being charted. That’s the first estimate of Q1’s GDP growth rate, and last month’s consumer spending and income data (which the biggest piece of information the Federal Reserve uses when making interest rate decisions).
As for the United States’ GDP, it only seems to have grown 1.6%, falling well short of estimates of 3.4%. Updates to this data might change it a little, but sweeping changes are rare. The economy is just tepid here.
As for income and spending both remain strong. Expenditures are up 2.7% year over year, while income is up by about as much, suggesting consumers can afford what they’re spending. This ultimately suggests inflation will remain above target, forcing the Fed to keep interest rates higher than they’d like at this point… particularly considering the lackluster economic growth we’re seeing.
Everything is on the grid.
Economic Calendar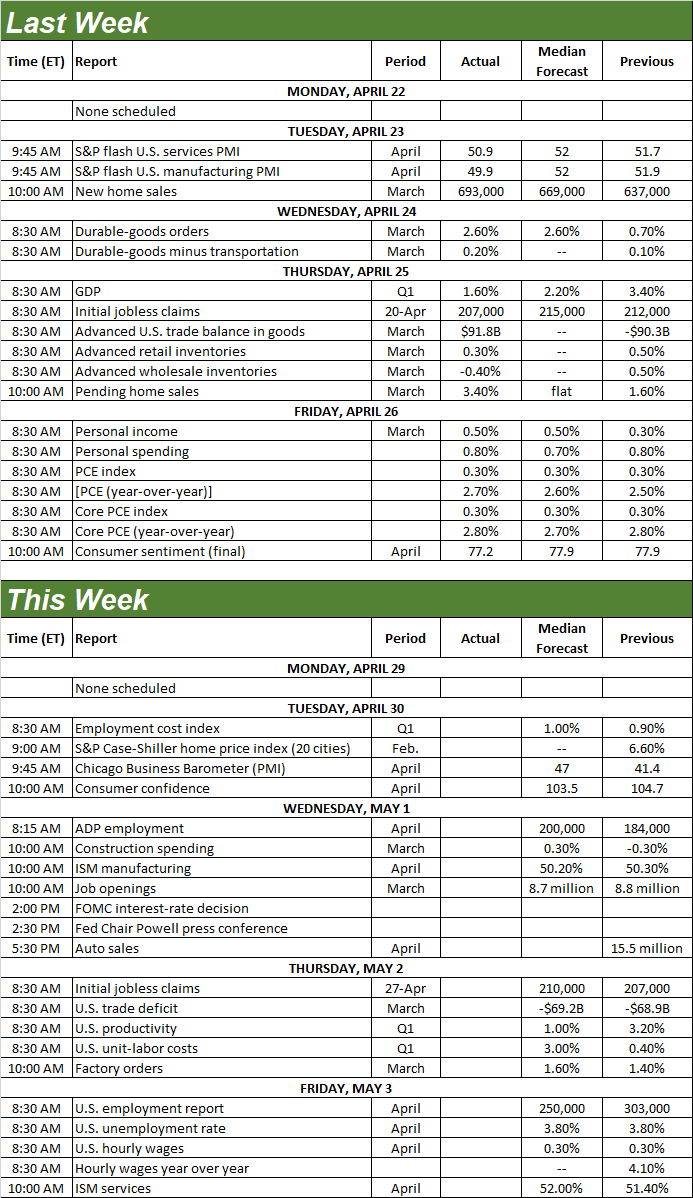
Source: Briefing.com
Speaking of the Federal Reserve and interest rates, we’re due for a decision on rates this coming Wednesday. Traders are betting there’s a 97% chance the FOMC won’t cut rates this time around. The market’s now saying we won’t see the next rate cut probably until September.
This isn’t the only news we’ll be getting this week, of course. On Tuesday we’ll hear the latest update of the S&P Case-Shiller Home Price Index along with the FHFA Home Price Index. Don’t be surprised to see both of them continuing to deteriorate following their recent peaks.
Home Price Index Charts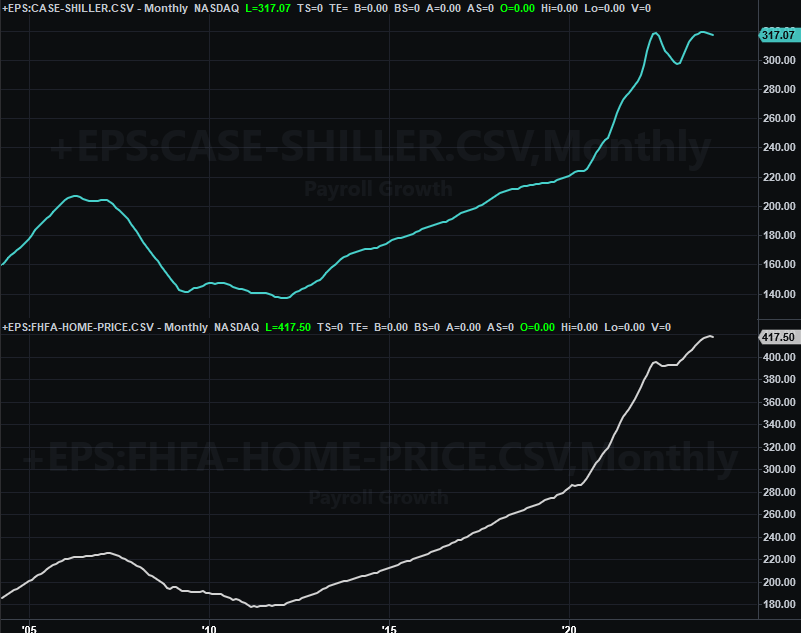
Source: Standard & Poor’s, FHFA, TradeStation
We’ll also be hearing April’s ISM numbers this week. The manufacturing data is due on Wednesday, while the services report is coming on Friday. This month’s numbers are expected to be more or less in line with March’s. But, as you can see on the chart below, these two different data sets are clearly moving in two different directions. That makes both of them less-than-dependable economic barometers.
ISM Services and Manufacturing Index Charts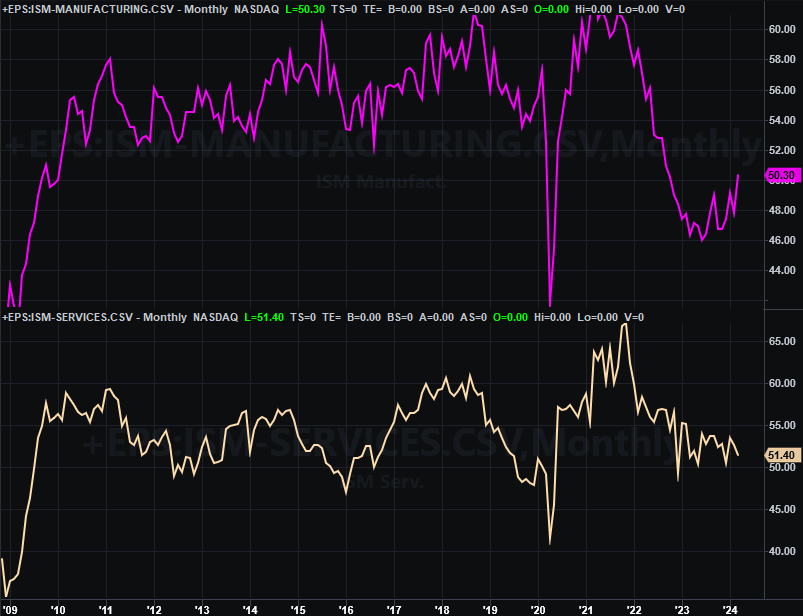
Source: Institute of Supply Management, TradeStation
Finally, on Friday we’ll get April’s jobs report. The unemployment rate should hold at 3.8% thanks to the addition of 250,000 newly-created positions. That’s down slightly from March’s number, but still says we’re near maximum employment levels.
Unemployment Rate and Payroll Growth Charts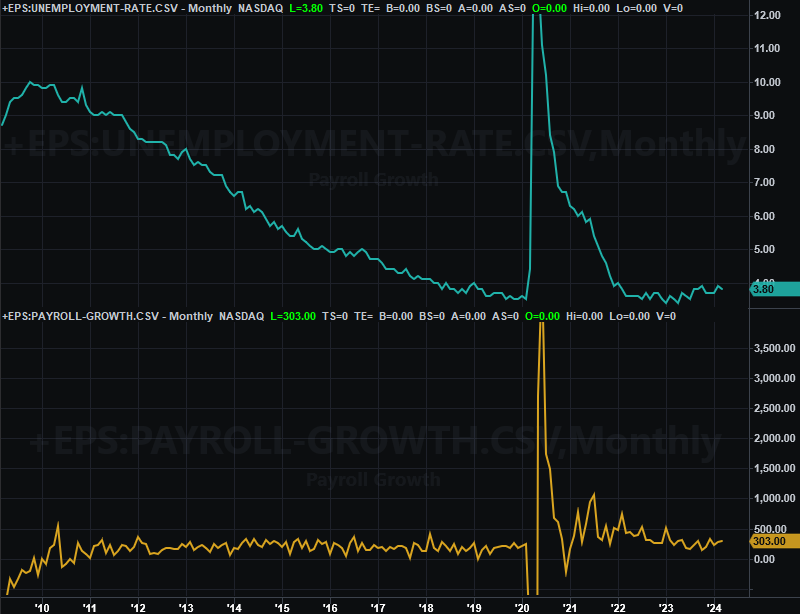
Source: Census Bureau, TradeStation
Just don’t read too much into this data. Many of these jobs were taken because they had to be, with lots of them being second (or equivalent) jobs taken by individuals looking to make ends meet. Multiple jobholders are now near pre-pandemic levels, which has negative economic implications.
Stock Market Index Analysis
Think the market’s all the way back in bullish mode? Not quite. It’s close to be sure. But, there’s one last hurdle to clear… and it’s a biggie. It’s so big, in fact, that the odds of stock’s clearing it are actually pretty low. Last week’s bounce was hot, but it may have only been a temporary move that will ultimately yield to the bigger pullback that began at the beginning of the month.
Take a look at the daily chart of the S&P 500 below. It bounced all the way back to the 20-day moving average line (blue), but not one inch further. Also notice the 20-day line just broke below the 50-day moving average line (purple)… another bearish sign. It’s also worth pointing out there wasn’t a lot of volume behind last week’s advance, suggesting there’s not a great deal of support for it.
S&P 500 Daily Chart, with VIX and Volume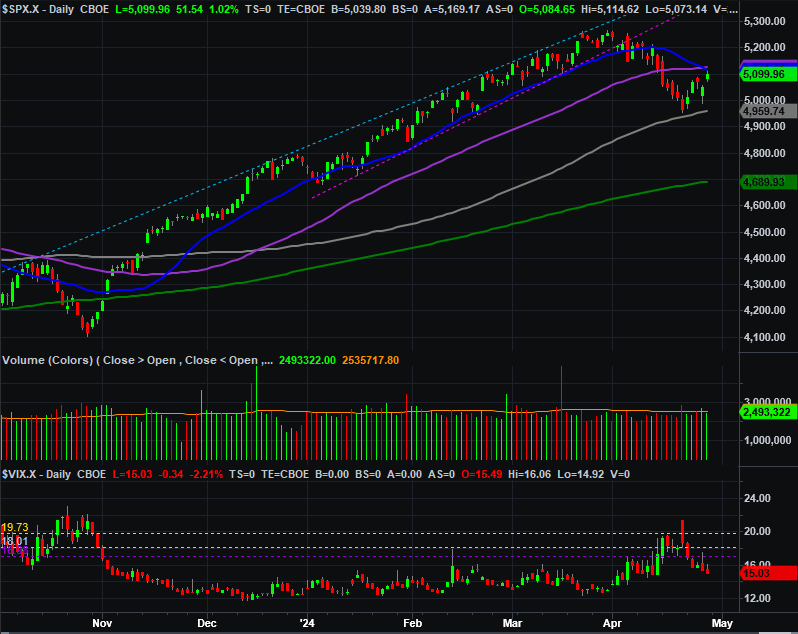
Source: TradeNavigator
The NASDAQ’s daily chart look about the same. The composite tested its 20-day moving average line -- which just broke under its 50-day line -- without going over it.
NASDAQ Composite Daily Chart, with VXN and Volume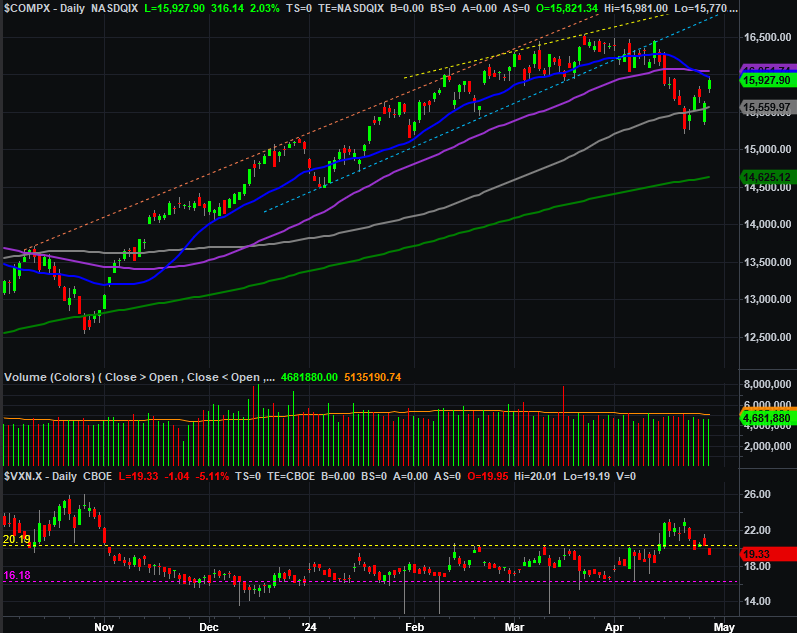
Source: TradeNavigator
Here’s the weekly chart of the S&P 500 for a little more perspective. The shape and placement of last week’s bar is noteworthy. It’s an inside day (or inside week, in this case) bar, meaning last week’s high and low are completely contained within the prior week’s open and close range, AND, the direction the market is moving are opposites. It’s a sign of a sudden and strong change of heart, which is how many long-lived rallies (and pullbacks) start out. We can’t rule out the possibility that last week marks the beginning or renewal of a bull trend.
S&P 500 Weekly Chart, with VIX and Volume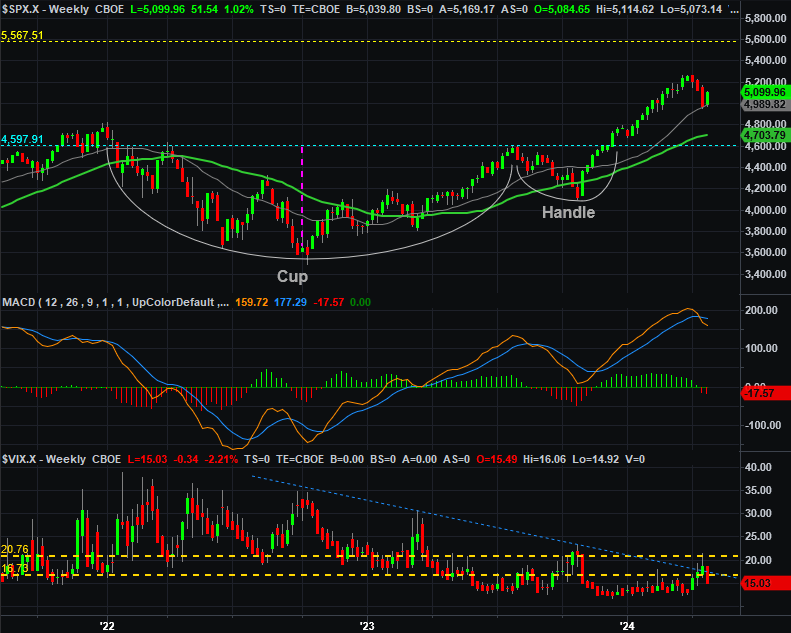
Source: TradeNavigator
And the weekly chart of the NASDAQ Composite chart is showing us the same inside week reversal effort.
NASDAQ Composite Weekly Chart, with VXN and Volume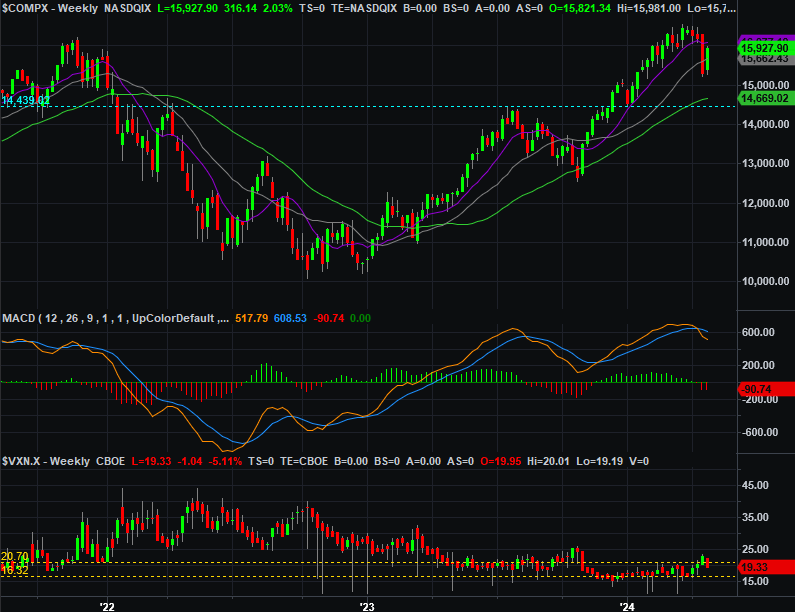
Source: TradeNavigator
So what do we do with all of this? First and foremost, we wait. We wait for clarity.
Given the extreme volatility of just the past two weeks it’s clear that traders aren’t quite sure how to interpret all the mixed economic signals they’re getting. Not unlike a cornered animal, that makes them dangerous because it makes them unpredictable. We actually need to wait for less volatile, more reasoned action before making a bigger-picture call.
As it stands right now, however, the bigger trend is still bearish despite last week’s big gain. The move can easily be chalked up as a dead-cat bounce. We can only consider shifting to a bullish stance if-and-when both of the indices here make their way back above their 20-day and 50-day moving average lines.