Weekly Market Outlook - This is Where Traders Have to Commit, or Flinch
 The bears had their opportunity to quell the rally - or at least shut it down for a while. When push came to shove as the three-day weekend approached though, the bulls wanted it more. Granted, the removal of the risk of another government shutdown gave the market the nudge it needed. But, even without that nudge it doesn't look like traders have any valuation concerns just yet.
There's still a chance for a small stumble here... a stumble that in some ways would actually be beneficial. The rally needs a good 'reset' so it can fully renew. It wouldn't even take much to do that, which we'll explain in some detail below.
Before we get to any of that analysis though, let's run-down last week's economic announcements and preview this week's reports. We got a curious, potentially misleading data nugget last week that we want to explore so we can ignore.
Economic Data Analysis
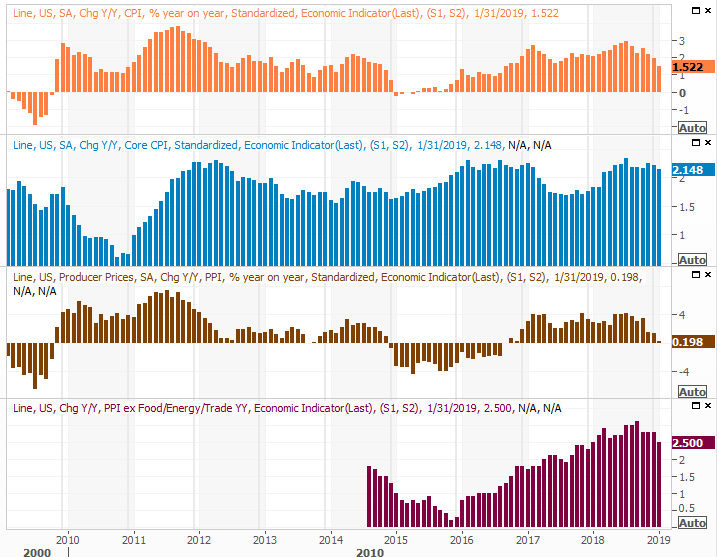
It's increasingly clear the Federal Reserve was right to not continue with rate hikes as aggressively as it did in 2018. Inflation is tame to the point of being non-existent. Although the risk of deflation is well down the road and likely to be avoided, the trend as of last month has to leave some wondering if something is quietly wrong. As of the latest look, the annualized consumer inflation rate stands at 1.5%, and has fallen for three straight months (and fallen six of the past seven).
Consumer, Producer Inflation Charts
Source: Thomson Reuters
Last week's biggest news was the December retail sales report, though it was also the most suspect. Consumer spending in stores fell 1.2% from November's levels, which is one of the biggest month to month drops in a decade.
It's also a drop, however, that should be taken with a grain of salt.
The formula is a bit complicated; the simple explanation is, the Census Bureau adjusts the monthly figure to account for calendar-based volatility like Christmas-related spending. Though on an adjusted basis the total amount of spending fell, on a raw, unadjusted basis, it was actually up.
Still, it was unusual, though also somewhat explainable. Much of the spending that's normally done in December has been pushed into January, as retailers work to earn holiday-related business before their competitors get a chance to. As a reminder, November's adjusted retail spending was up, and October's retail spending was up almost a full percentage point. For all of Q4, retail consumption grew at its normal pace, and was the best quarter on record.
We explored the matter in detail at the website: https://www.bigtrends.com/education/no-decembers-retail-sales-didnt-fall-at-least-not-how-you-think/
To that end, the visual 'blip' evident on the chart below may not mean as much as it seems.
Retail Sales Growth Charts, YOY
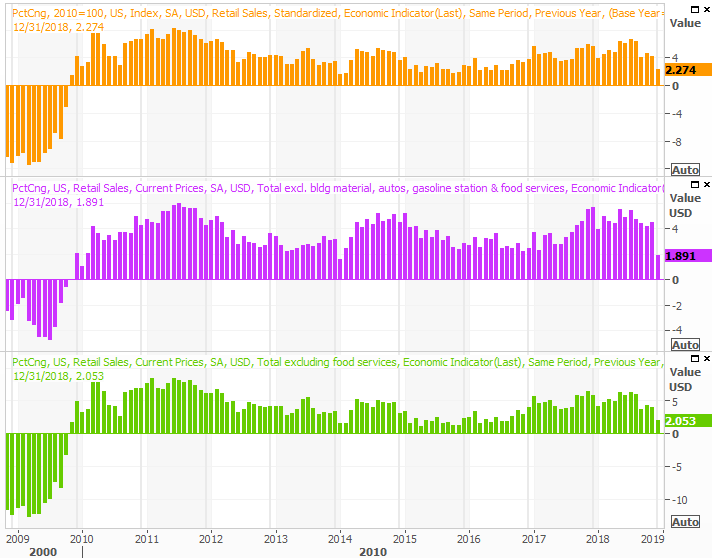
Source: Thomson Reuters
Finally, January's industrial production and capacity utilization both fell last month, snapping a pretty solid win streak. But, the lull was 100% attributable to a government shutdown that's now come to a close. The effect of that shutdown could linger into this month. We'd only need to worry of March's figures were still weak.
Industrial Productivity, Capacity Utilization Charts
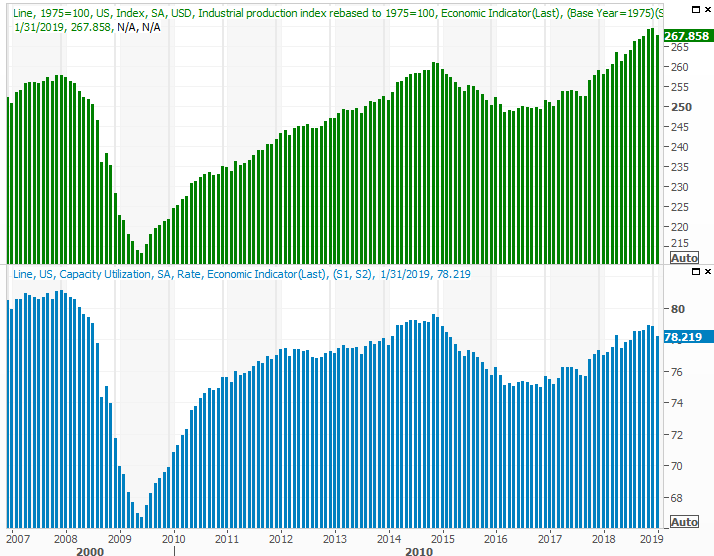
Source: Thomson Reuters
Everything else is on the grid.
Economic Calendar
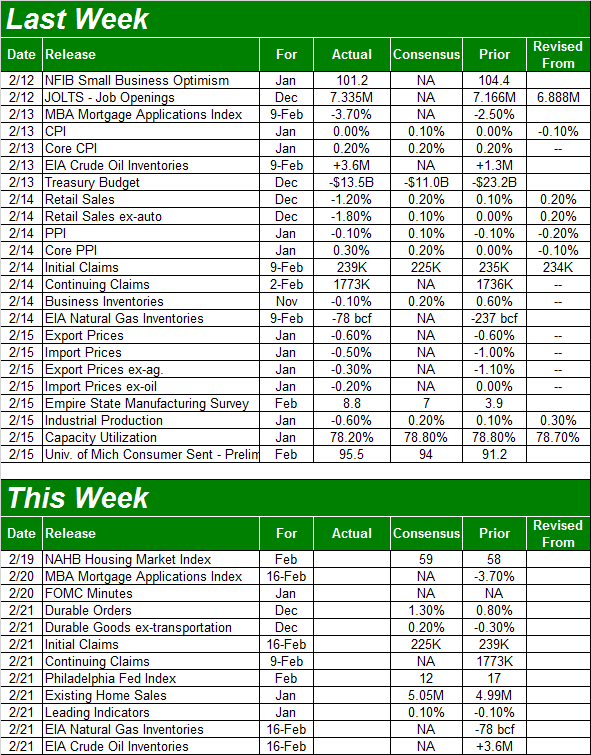
Source: Briefing.com
This shortened week won't be nearly as busy, though there are a couple of items worth keeping an eye on. One of them is Wednesday's release of the minutes from the last FOMC meeting. It's not a regularly scheduled meeting would spur a rate increase, though it does offer up some insight as to what the board of governors is seeing, and thinking.
On Thursday look for January's report on existing home sales.
Although we've yet to hear updates on new home sales since November due to the government shutdown, existing home sales - which comes from a different source - have continued to post. The news hasn't been especially good though, with sales continuing to slump. The good news is, the sales slump isn't leading to an unhealthy surge in inventory.
New, Existing Home Sales and Inventory Charts
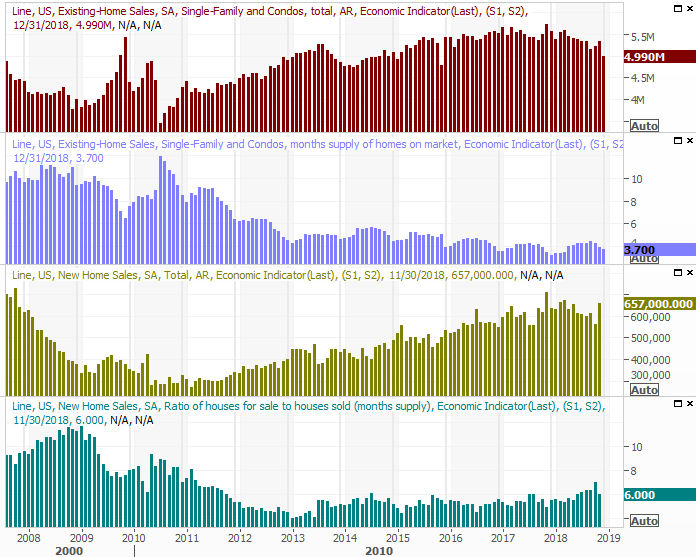
Source: Thomson Reuters
Finally, it wouldn't be of so much interest had it not risen so persistently since the fall of last year. But, crude oil inventories are starting to build in earnest again as U.S. producers grow - and use - their capacity. It's a trend that works against the very oil prices drillers are hoping to plug into.
Crude Oil, Natural Gas Inventory Charts
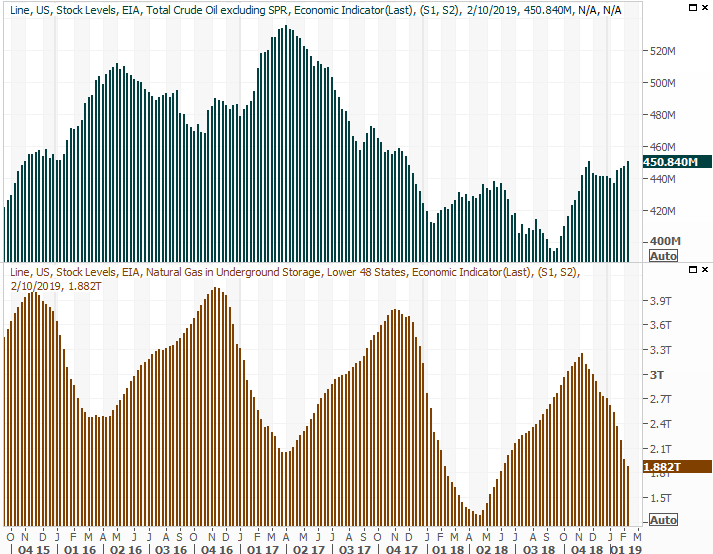
Source: Thomson Reuters
Stock Market Index Analysis
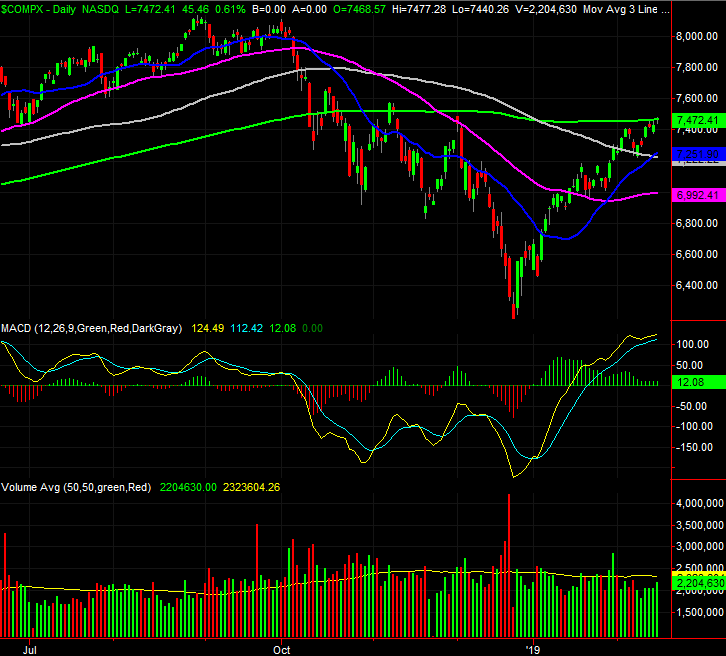
Good news for stocks.... the S&P 500 crossed above its 200-day moving average line last week, after stalling just below it a week earlier. Bad news for stocks... the NASDAQ Composite didn't hurdle its 200-day line last week. Instead, it bumped into that ceiling and could move no further.
It may only be a temporary pause; the momentum remains impressive. But, the ideal move from here to make that happen is actually a small step back first and then a renewed effort that gets the NASDAQ up and over the hump as well. It also can't be ignored that the volume behind the last two weeks of the rally has been below average.
Let's just start this week with a look at the daily chart of the NASDAQ. It speaks for itself. The runup's been nice, but the effort thus far is slowing down.
NASDAQ Composite Daily Chart, with Volume
Source: TradeStation
The daily chart of the S&P 500 is in the same basic shape, though as was noted, it's up and over the 200-day moving average line. The daily chart of the S&P 500 is also bumping into a falling resistance line (yellow, dashed) that's tagged all the major peaks since mid-October though. It remains to be seen if that will be a problem.
S&P 500 Daily Chart, with Volume
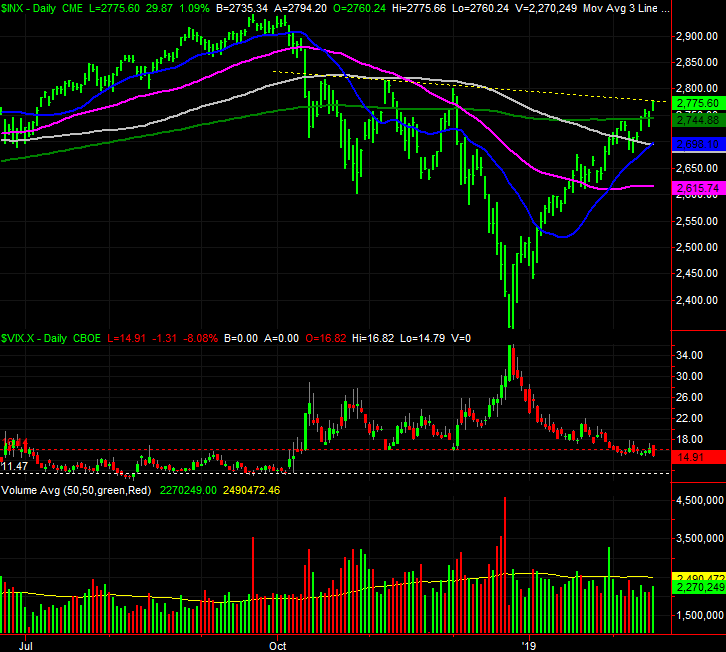
Source: TradeStation
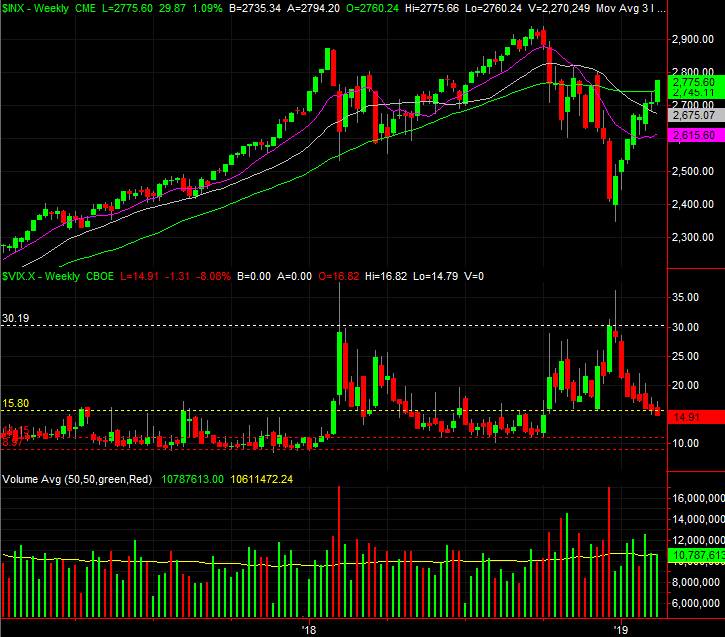
We've kept close tabs on it for weeks, but with little fanfare. The VIX is slowly inching toward an absolute floor around 11.5. Meeting that floor doesn't inherently mean the market can't keep moving higher. But, it does make forward progress more difficult.
Zooming out to a weekly chart of the NASDAQ Composite gives us some more perspective on where we were, and where we are. It's also on the weekly chart of the NASDAQ we can see the composite and the VXN actually have more room ahead of them for bullishness than the S&P 500 does. That might be encouraging, though that lag is also a red flag. Strong rallies should be led by the NASDAQ. This one isn't being led by the composite.
NASDAQ Composite Weekly Chart, with Volume
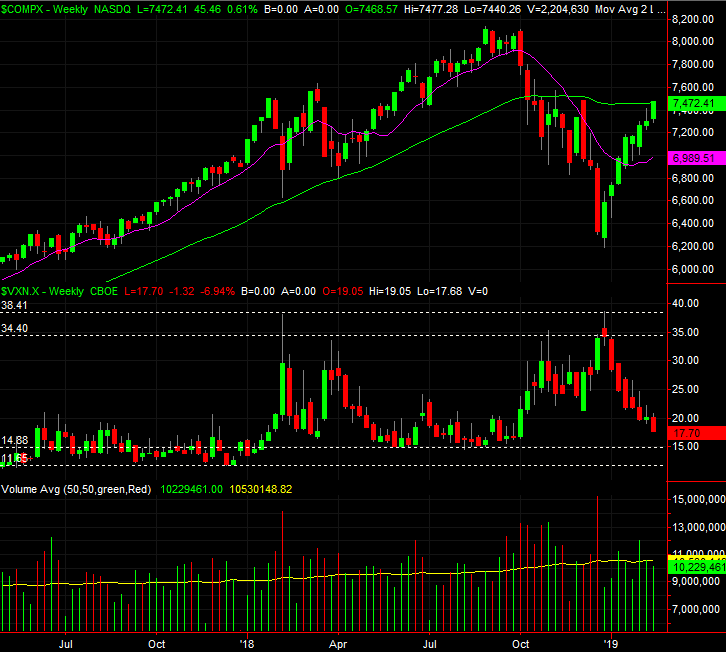
Source: TradeStation
The weekly chart of the S&P 500....
S&P 500 Weekly Chart, with Volume
Source: TradeStation
It's a tricky situation. Stocks are overbought in the short run, but more than that (for better or worse), they're hijacked by headlines, which shift directions on a near-daily basis. The wrong news at the wrong time could easily up-end the current-but-fragile rally. A little disruption could actually be a good thing though. A dip back to the 20-day or 100-day moving average line for the S&P 500 would actually be a good reset for the rally.
Bottom line? Now might be a good time to wait on the sidelines and see what's really going on here. More upside without a dip would actually be unhealthy and set up some significant profit-taking. At the other end of the spectrum, a dip that drags the S&P 500 under the 100-day moving average line currently at 2695 could inspire even more selling. Both outcomes are equally possible here.
Even more so than usual, right now, follow the volume. We haven't had a decided amount of volume leaning either way in a while, suggesting a lack of conviction altogether.