Weekly Market Outlook – The Market’s Gains Are Getting Tougher to Make, But…
The market mustered another win last week, although this is the weakest of the last three weekly gains. The S&P 500 only finished the week up 1.0%, peeling back from its highs. The NASDAQ Composite peeled back even more. The volume behind the move wasn’t exactly staggering either. Traders are once again starting to doubt there’s a great deal more upside left to plug into.
That’s certainly no guarantee a major selloff is brewing. There’s plenty of support below to stop any pullback from picking up too much steam. Even more is on the way too. It’s just going to be tough for the rally to carry on without some sort of regrouping first.
We’ll lay out these details below in a moment. Let’s first look at last week’s top economic reports and preview what’s coming this week. These numbers are starting to impact the market in more serious ways again, for better or for worse.
Economic Data Analysis
We didn’t get a great deal of economic news last week. What we got, however, was more encouraging than not.
Take last quarter’s GDP growth rate as an example. Economists thought the nation’s economic growth pace was likely to slide from Q3’s 4.9% to 2.0%. But, the reading of 3.3% suggests the recovery is more robust than expected. Just bear in mind this is only a tentative figure based on rapidly-changing data. It could still be changed in a sizable way in the near future.
Sales of new homes was also a pleasant surprise. While December’s pace of 664,000 is still relatively modest, it’s a measurable improvement on November’s figure. Just bear in mind that pace is still nowhere near offsetting the steep dropoff in sales of existing homes that points to weakness in the real estate market. Also note that we’ve seen modest bullish blips in new home sales, to no long-lived avail.
Home Sales Charts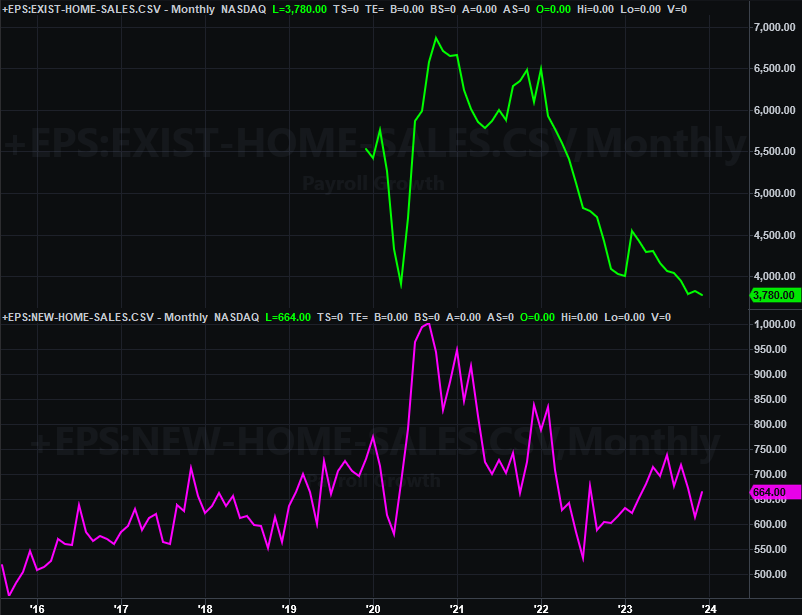
Source: Census Bureau, National Association of Realtors, TradeStation
The only other noteworthy number posted last week is last month’s consumer income and consumer spending data. But, this is monumentally important information. This is the primary data the Federal Reserve considers when making decisions on interest rates. To this end, wages continue to grow, but spending continues to grow a little more despite higher prices. This leaves the FOMC in a bit of a pickle, suggesting (more than not) that easing rates lower could spur more inflation than the fragile economy can actually handle in the long run.
Everything else is on the grid.
Economic Calendar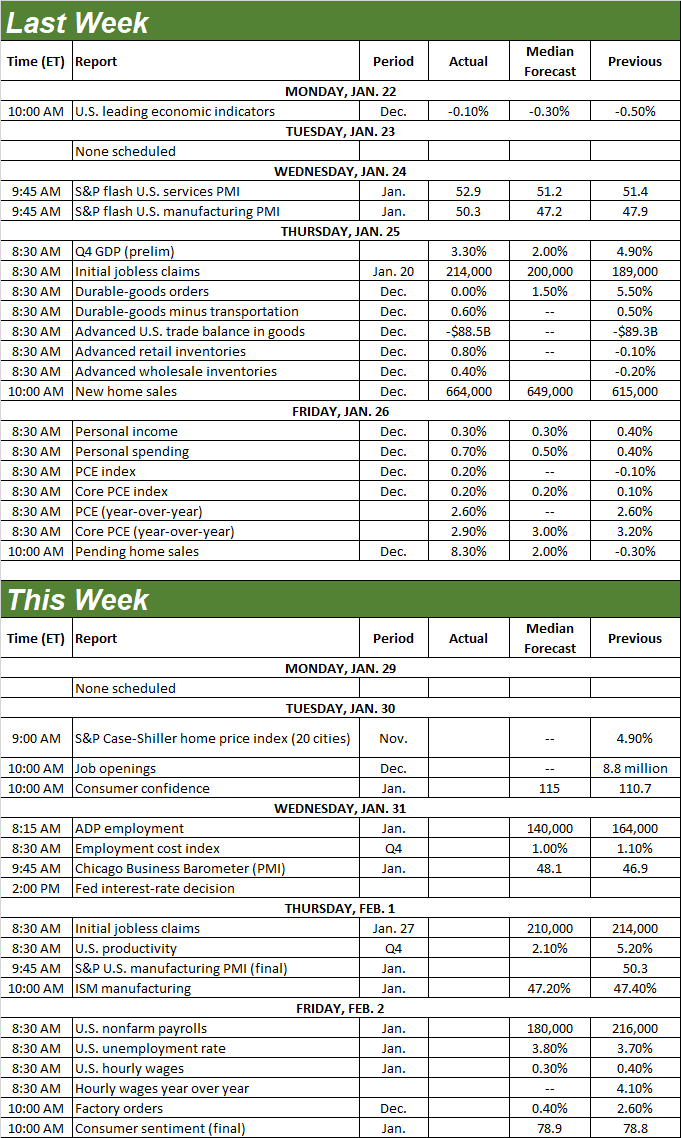
Source: Briefing.com
This week’s going to be a biggie for a lot of reasons.
The party starts in earnest on Tuesday with November’s home-price data, in the form of the Case-Shiller Index as well as the FHFA Home Price Index. Both have remained on the rise, although do note that the former seems to be slowing down now as more expensive homes in larger cities are finally struggling to maintain their recent price momentum. Also note that this data only considers average transaction prices. It doesn’t reflect that the total number of home sales remains quite low.
Home Price Index Charts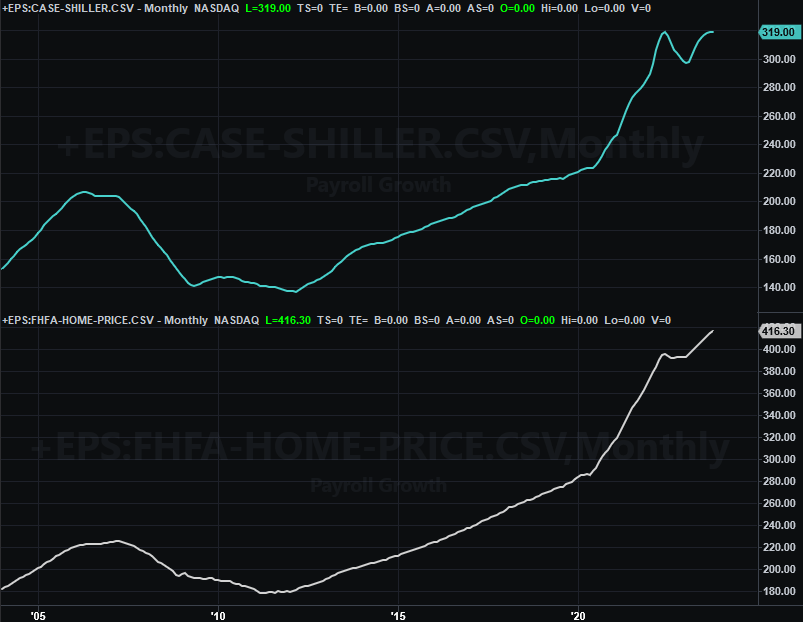
Source: Standard & Poor’s, FHFA, TradeStation
It’s also a big week for consumer sentiment. The Conference Board’s measure of consumer confidence is due on Tuesday, with the month’s third and final look at the University of Michigan’s consumer sentiment index coming on Friday. Both have been rising of late, and economists believe this trend is still in place.
Consumer Sentiment Charts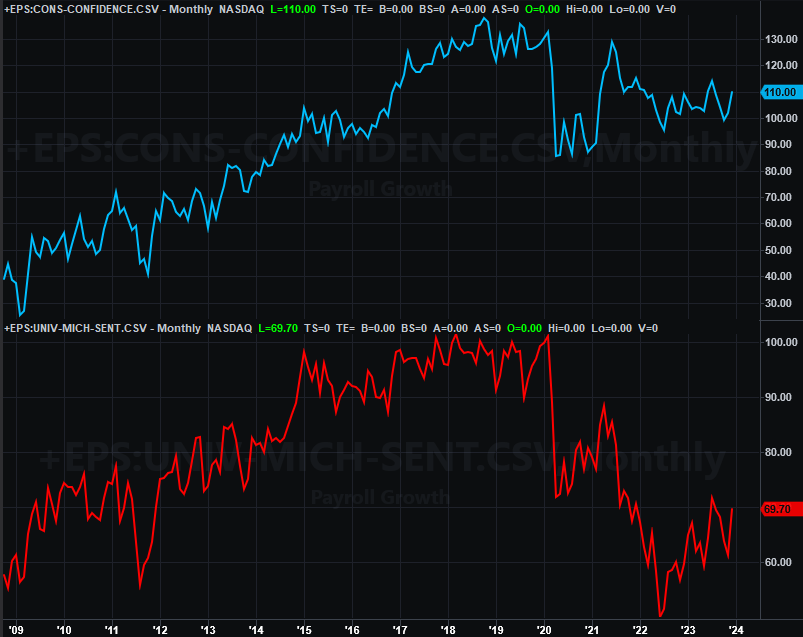
Source: University of Michigan, Conference Board, TradeStation
Look for the Institute of Supply Management’s measure of manufacturing activity to be released on Thursday. Forecasters are calling for another subpar (sub-50) reading, mirroring the weak measure of services activity. These numbers are cause for concern, even if they are opinion polls.
ISM Services and Manufacturing Index Charts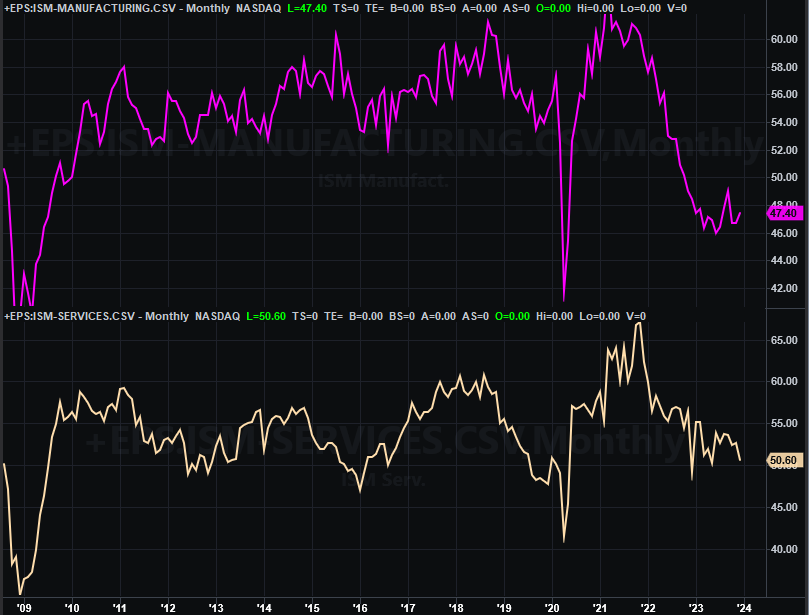
Source: Institute of Supply Management, TradeStation
Look for the Institute of Supply Management’s measure of services activity on Monday of next week.
This week’s big Kahuna, of course, is Friday’s jobs report. Both have been inching slowly for the worse, and will likely continue this weakening trend through January. Payroll growth is expected to fall from November’s pace of 216,000 jobs to 180,000, while the unemployment rate is likely to grow from 3.7% to 3.8%. A lot of the structural problems linked to lingering inflation and slowing economic growth are starting to rear their heads.
Unemployment Rate, Payroll Growth Charts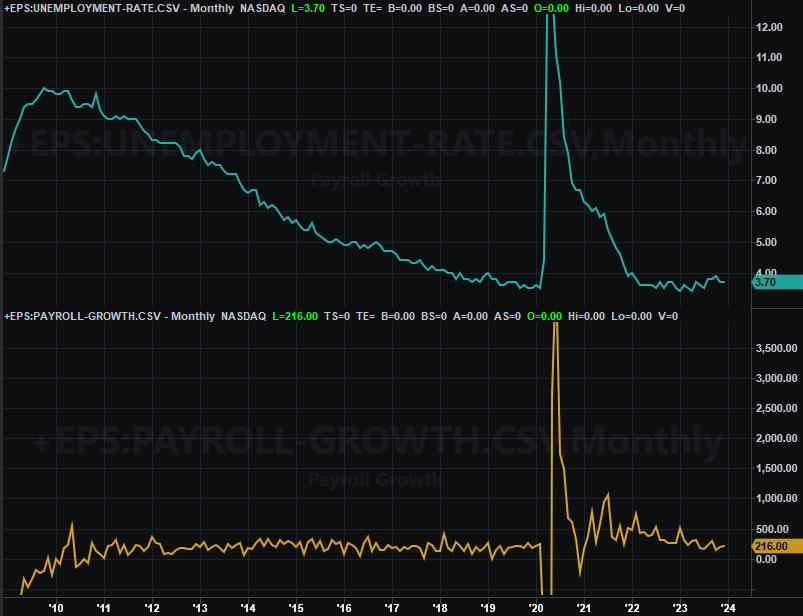
Source: Census Bureau, TradeStation
Stock Market Index Analysis
Another week, another win. But…
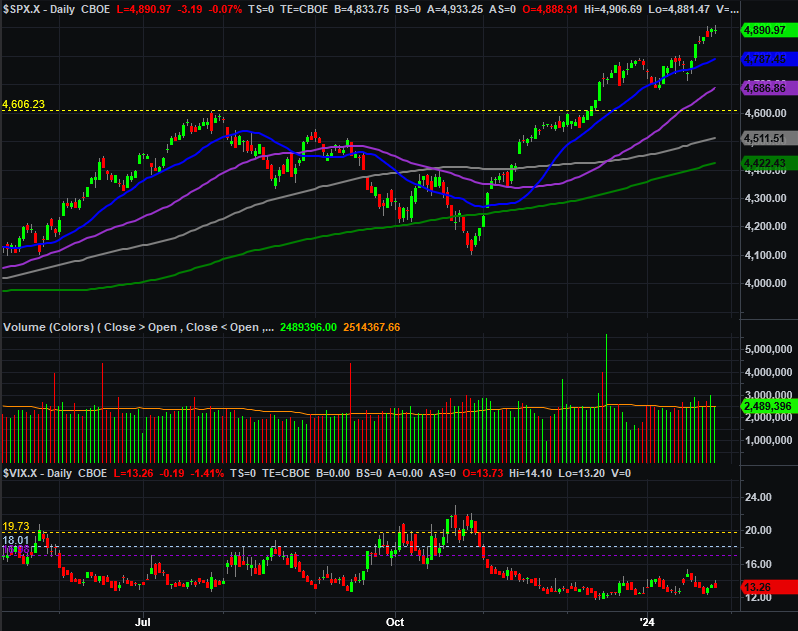
We start this week’s analysis with a look at the daily chart of the S&P 500. There’s one overarching takeaway with this chart that we want to acknowledge. That is, while still climbing, the pace of gains is slowing down. That’s got a lot to do with the sheer still-overbought condition we’re in thanks to the big rally from October’s low. As of Friday’s close the S&P 500 is now more than 10% above its 200-day moving average line (green) at 4422. For perspective, the index was only 13% above its 200-day line back in July, right before a sizeable correction took shape.
S&P 500 Daily Chart, with VIX and Volume
Source: TradeNavigator
The daily chart of the NASDAQ Composite looks pretty similar, although there’s one additional noteworthy detail here. That is, the composite stopped its advance once it bumped into the straight-line resistance (orange, dashed) that connects most of the key highs going back to November.
NASDAQ Composite Daily Chart, with VXN and Volume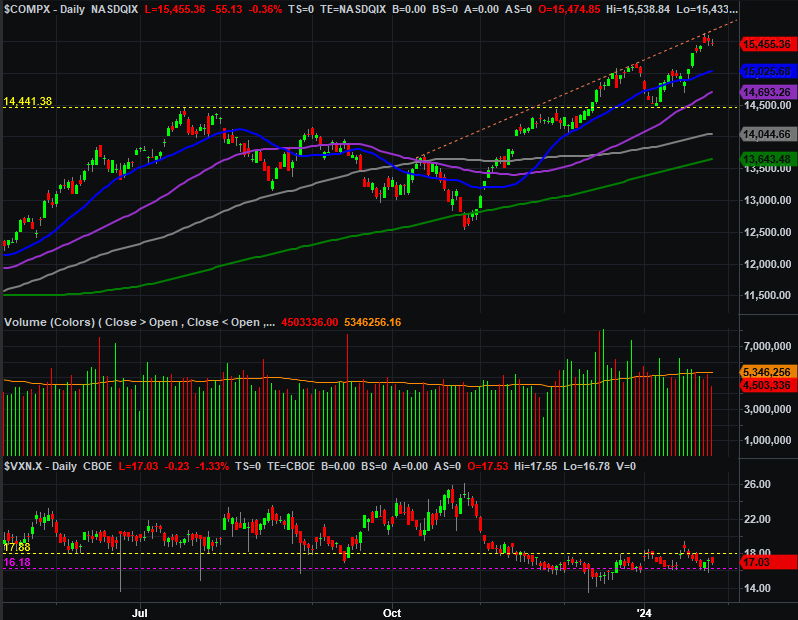
Source: TradeNavigator
Now take a step back and look at the weekly chart of the NASDAQ Composite. This near-term resistance is still evident. But, from this viewpoint we’re also reminded the index completed a head-and-shoulder breakout pattern by breaking above the brim line (light blue, dashed) at 14,439. That’s bullish, or in this case, still bullish despite the near-term headwind. Even if the sellers push back and drag the market down from last week’s peak, as long as the NASDAQ doesn’t tumble under that brim line back at 14,439. And with the 100-day (gray) and 200-day (green) moving average lines now moving higher, they could help come to the market’s rescue in such an event.
NASDAQ Composite Weekly Chart, with VXN and Volume
Source: TradeNavigator
Here's the weekly chart of the S&P 500. We’re seeing the cup-and-handle breakout here too, and it’s still intact on this chart as well. The only real difference here as that the S&P 500 is actually into record-high territory now, underscoring the overall bullishness. (Generally speaking, you want to buy new highs, as it’s a sign of strength more than it’s a warning of a brewing pullback.)
S&P 500 Weekly Chart, with VIX and Volume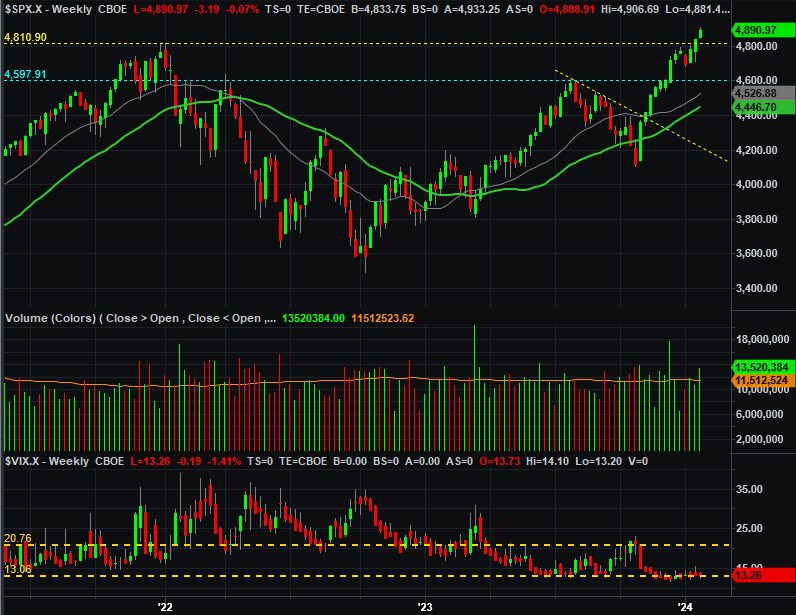
Source: TradeNavigator
With all of that being said, the net conclusion here remains a bullish one… albeit one with a near-term worry of profit-taking. Don’t sweat it if we see it -- at least not initially. As was noted, there’s room for a little downside without snapping the uptrend. In fact, a little bit of a cooling-off now might be the best thing for the bigger-picture rally in the long run.