Weekly Market Outlook - The January Effect Is In Full Swing

Despite a rather bearish first trading day of the new year, stocks logged a great first full week. By the time Friday's closing bell rang the S&P 500 had rallied 1.8% from 2020's close, reaching record highs (again) to end the week in question. Fresh certainty regarding the country's 2020 election and subsequent runoff races was celebrated, regardless of any company-specific or COVID news.
The bullish start to the year implies we'll at least finish the month on a bullish foot... the so-called January Effect. That of course will only exacerbate the market's already-overbought condition. But, perhaps it won't matter; it hasn't mattered yet. As the old adage goes, don't fight the tape.
If you're a believer in the idea that all things eventually return to the mean though, every step forward makes this rally even more concerning.
We'll look at everything in some detail below, as always. First, however, let's run down last week's big economic announcements and preview what's in store this week.
Economic Data Analysis
There were only two data sets released last week that were of only real interest, but they were both biggies.
One of them was a look at last week's supply management numbers. The Institute of Supply Management's manufacturing index jumped from 57.5 to 60.7 rather than falling back to the expected 56.4, while the services index improved to 57.2 from November's reading of 55.9. The pros were calling for a figure of 54.7. That's the highest manufacturing reading we've seen since 2018, suggesting America's factories and production plants are incredibly busy. The services measure only matched its readings seen around the middle of last year when things were easing back to normal. Even so, it's still well above the critical 50 level that delineates economic growth and economic contractions.
ISM Manufacturing and Services Index Charts
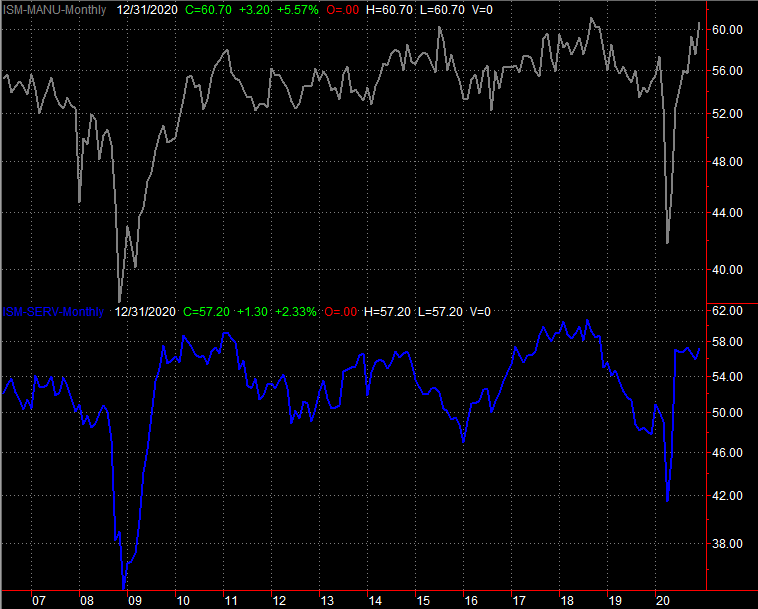
Source: Institute of Supply Management, TradeStation
The other report worth mentioning from last week came from the Department of Labor. Though it wasn't enough to drag the unemployment rate lower than November's 6.7%, the nation lost 140,000 jobs versus the 112,000 economists were planning on seeing added.
Payroll Growth and Unemployment Rate Charts

Source: Department of Labor, TradeStation
It's not as alarming as it seems. The first looks have been more wrong than usual of late, and consider the environment. Also consider that a resurgence of COVID cases is a reason we've seen job growth wane in recent weeks. That headwind should abate in the foreseeable future.
Everything else is on the grid.
Economic Report Calendar
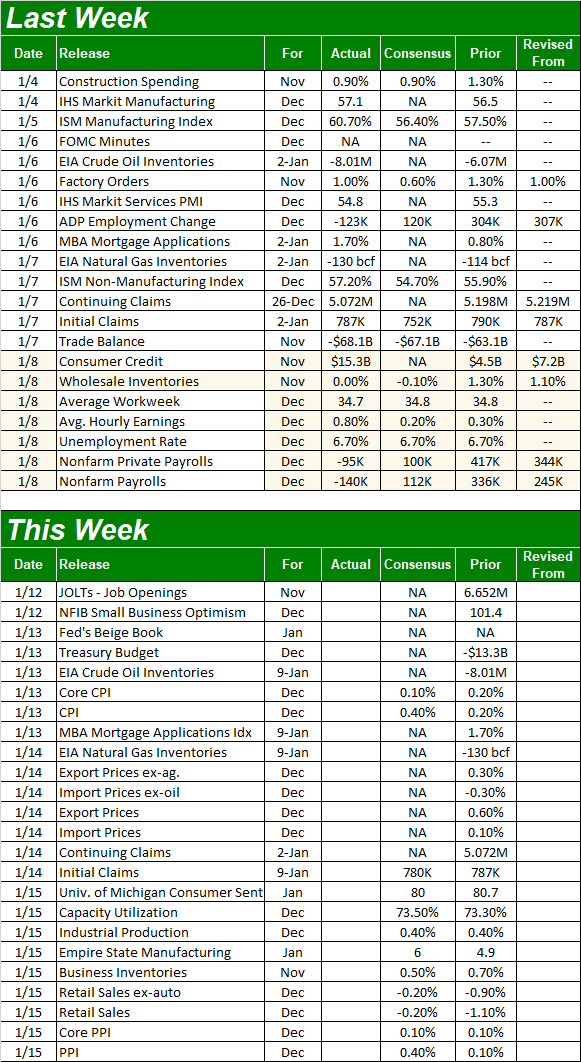
Source: Briefing.com
Things are going to be a little busier this week, starting with inflation. We'll get consumer inflation figures on Wednesday, and producer inflation data on Friday. Both have been surprisingly muted considering the amount of dollars that have been injected into circulation of late, coupled with ultra-low interest rates. The annualized inflation rate (for consumers) now stands at a palatable 1.17% -- below the Fed's target of around 2.0% -- and economists don't think prices soared in December.
Consumer, Producer Inflation Charts
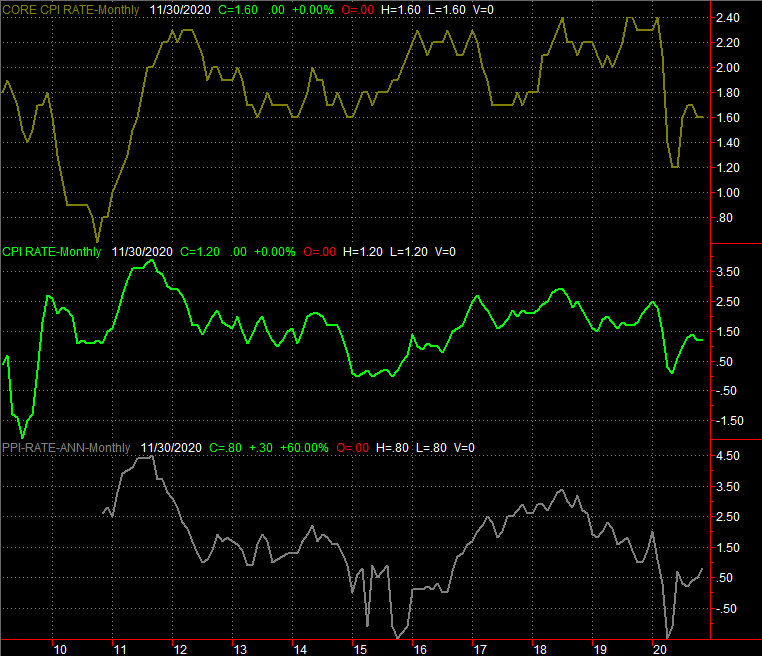
Source: Bureau of Labor Statistics, TradeStation
As long as inflation remains tame, the Federal Reserve won't be in too much of a hurry to turn hawkish.
Also on Friday look for last month's retail sales spending data. Forecasters are predicting a slight drop (year over year), but again, consider the circumstances. Consumers were mostly willing, but lockdowns and coronavirus fears made it difficult to spend the way they normally might. Regardless, the bigger retail spending trend remains a pretty healthy one.
Retail Spending Charts

Source: Census Bureau, TradeStation
Finally, Friday will also give us last month's capacity utilization and industrial production figures... one of the economy's bright spots of late. While still nowhere near their pre-COVID levels (when both were on their way down), each figure is still moving higher. Economists are calling for a little more progress for both in December.
Capacity Utilization and Industrial Productivity Charts
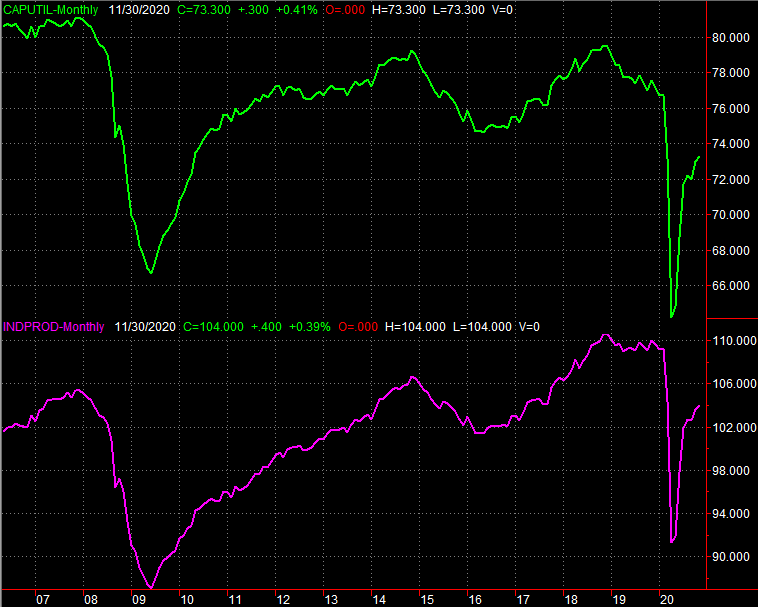
Source: Federal Reserve, TradeStation
Stock Market Index Analysis
We start this week's analysis out with a close look at the daily chart of the S&P 500. It speaks volumes. Notice that once again the 20-day moving average line (blue) acted as a springboard to catapult the index to record highs, stopping Monday's pullback from digging in too deep. It's not the first time we've seen it happen either. The 20-day line nudged the index upward for most of December.
S&P 500 Daily Chart, with VIX and Volume

Source: TradeNavigator
Note the VIX played along. That is to say, when the S&P 500 was finding support at its 20-day moving average line, the VIX was bumping into resistance... the falling technical ceiling that extends backwards for several months.
The big question of course is one of sustainability -- can this rally really continue? The VIX is now within easy reach of its well-established floor around 20.0, and the S&P 500 itself is now 17% above its 200-day moving average line. That's very extreme, as the weekly chart of the index better illustrates. That's as far removed (bullishly) as it's been in years; this is an extreme that should be tough to sustain.
S&P 500 Weekly Chart, with VIX and MACD
Source: TradeNavigator
That doesn't mean it can't be, or won't be. It just means the odds are stacked against the possibility.
That's especially the case when exploring the NASDAQ Composite's weekly chart. The composite now stands 22% higher than its 200-day moving average line (green) at 10,812. It's not been that far ahead of itself since early 2000 (and we all know how that ended).
NASDAQ Weekly Chart, with VXN and MACD
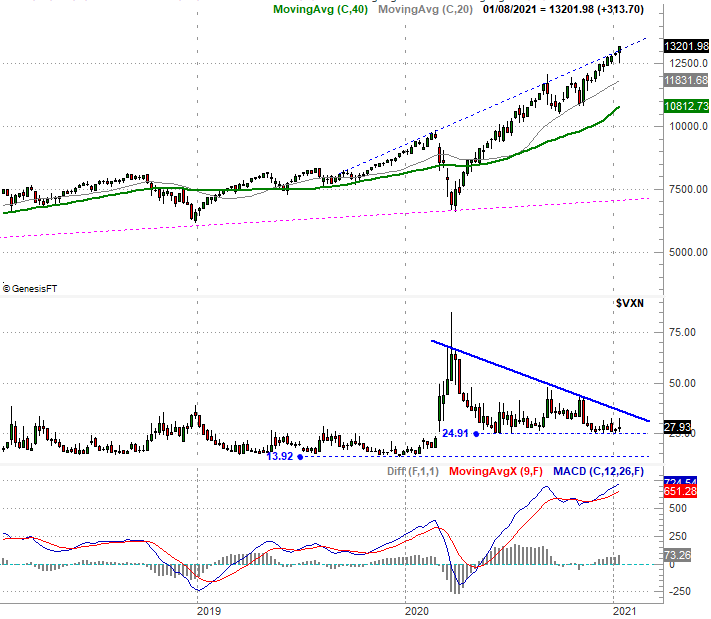
Source: TradeNavigator
Moreover, the composite's P/E ratio -- forward and trailing -- is more expensive than it's been in years compared to earnings. It's trading at 40 times trailing earnings and 31.2 times its projected profits. That forward-looking P/E isn't outrageous but certainly stretched.
Both weekly charts, of course, are telling us there is more room for the Volatility Indexes (the VIX and VXN) have some room to move lower, if they can break under their more recent floors. It would also be naive to believe political certainty isn't something traders are celebrating. Democrat or Republican, we now at least know what to expect for at least a couple of years. We also know, as the old adage goes, to not fight the tape.
Still, it would be short-sighted to not update plans for what any overdue market correction might look like.
To this end, we'll start with plotting Fibonacci retracement lines on the S&P 500's weekly chart. Assuming the 20-day moving average line fails to hold up as a floor with the next setback, the next-nearest likely floors are the 100-day moving average line (grey) at 3529 and the 200-day line (green) at 3305. Under that, the 38.2% Fibonacci retracement line at 3206 -- a 38.2% retracement of the rally from March's low to last week's high -- is the next most likely support level. Notice that the area was a floor a couple of times in the latter half of last year, in September and then again in October.
S&P 500 Weekly Chart, with Fibonacci Retracement Lines
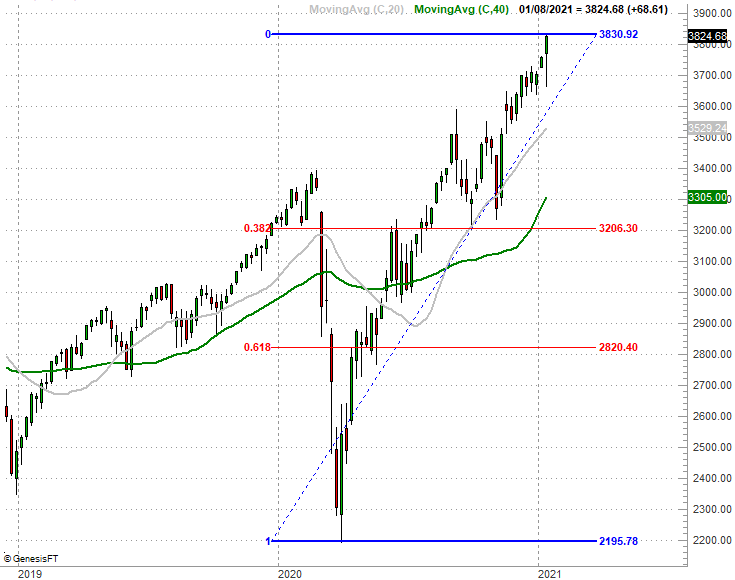
Source: TradeNavigator
That seems like it's a mile away, but a pullback to that level from the S&P 500's current value would only be a 16% correction from its recent peak. That's a lot, but not an unheard of selloff within a bull market... particularly following a 74% rally in less than ten months.
That's not a call, to be clear. It's just a possibility. And, the Fibonacci floors as well as any support caused by the moving average lines will move higher as long as the market does. Don't etch these potential support lines in stone. Still, it's not wrong to plan for the worst even if we continue to hope for -- and ride -- more rally.