Another week, another win. That's the third weekly win in a row, with this one carrying the market - or at least the S&P 500 - to record highs.
We have to take the bullishness at face value and presume the momentum will remain in place until it's clear it's out of gas. But, things didn't end ideally. The stretched, overbought market is vulnerable to some profit-taking here, and Friday's lull suggests at least some traders are already testing those waters. Both of the key volatility indices are also at absolute floors, suggesting more gains from here could be tough (although not impossible) to produce.
We'll take a close-up look at it below, as we always do. First, however, let's recap last week's biggest economic reports and take a look at what's in the queue for this week. There's a lot in the lineup, although not much of it is all that important.
Economic Data Analysis
There wasn't a lot of economic data posted last week, but what little there was wasn't particularly great.
Case(s) in point: September's capacity utilization and industrial productivity were supposed to edge slightly higher from August's levels. But, they peeled back just a bit. It's not an encouraging sign that this economic rebound is still moving forward.
Capacity Utilization and Industrial Productivity Charts

Source: Federal Reserve, TradeStation
One stalled month doesn't make a trend. One tepid month, however, is the first step to two or more disappointing months. This is definitely worth watching, as industrial production and capacity utilization are closely tethered to corporate earnings and the long-term market.
Housing starts and building permits were also lackluster. Starts were supposed to roll in at 1.62 million, up from August's 1.58 million. But, they fell to 1.55 million. Permits were projected to slide back from 1.72 million to 1.67 million, but the print of 1.59 million fell well short of forecasts.
Housing Starts and Building Permits Charts
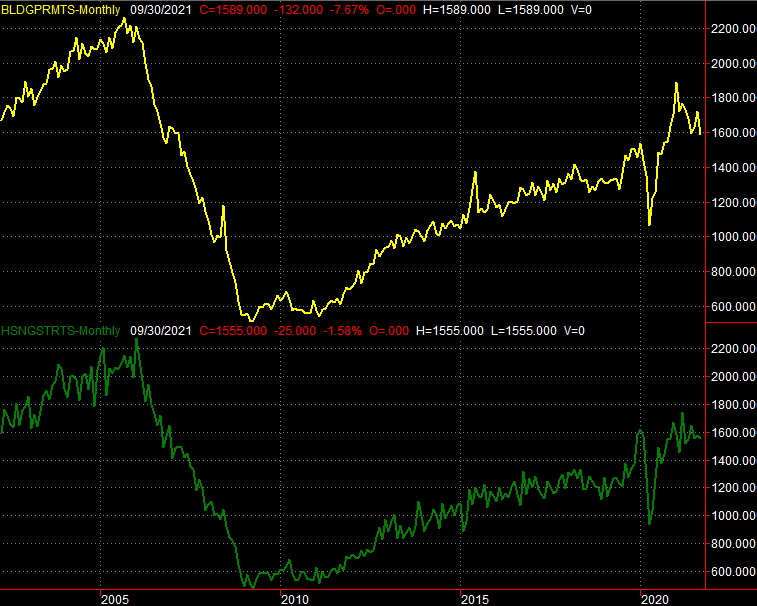
Source: Commerce Department, TradeStation
Although choppy, residential construction is weakening. We may be at a cyclical peak in demand. Last month's uptick in sales of existing homes (meaning already-owned and not recently built) marks the third time in the past four months that data has improved, underscoring the idea that would-be buyers have lost interest in more expensive new construction. The big pullback in new home sales says the same thing, jibing with last month's dip in starts and issued permits.
New and Existing Home Sales Charts
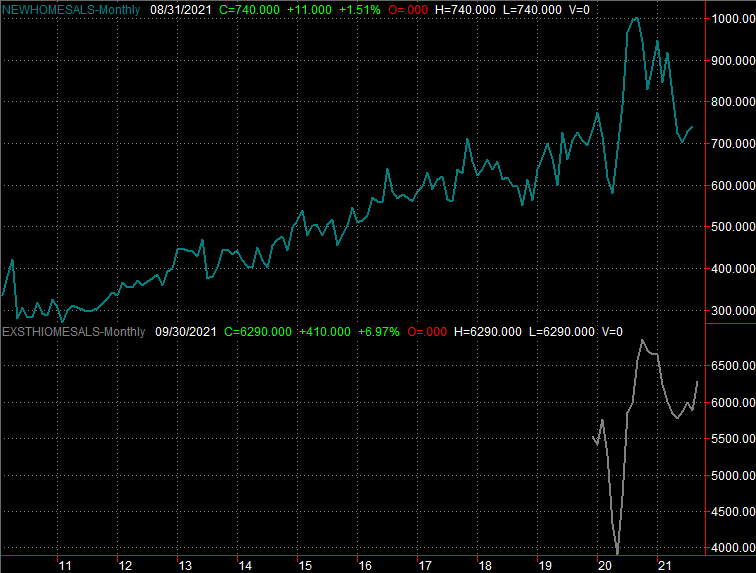
Source: National Board of Realtors, Census Bureau, TradeStation
New home sales for September will be reported this week. That's going to round out the picture of what and how consumers are thinking about home ownership. Everything else is on the grid.
Economic Calendar
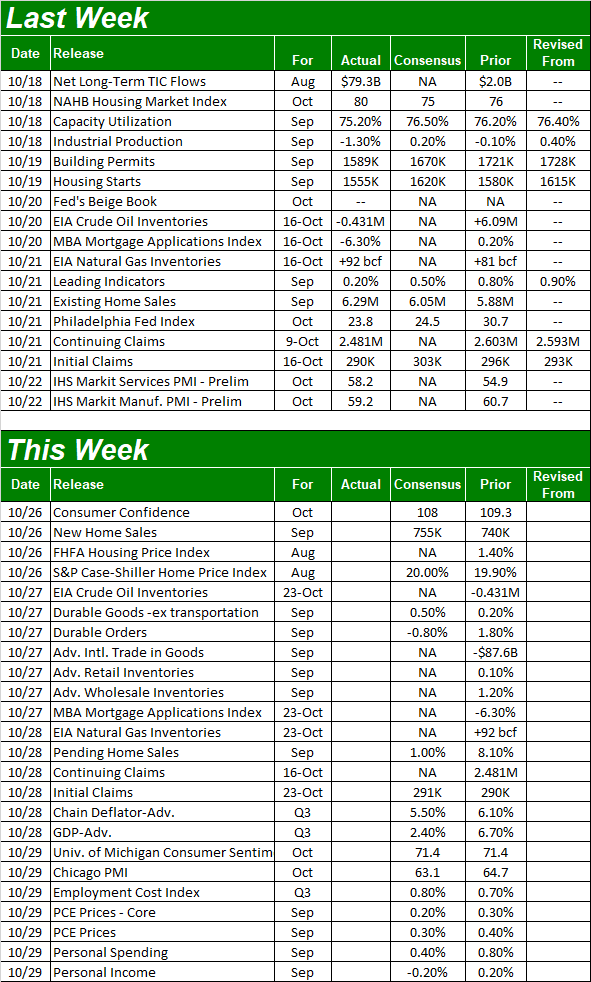
Source: Briefing.com
Aside from new home sales, we'll also hear a couple of key home-pricing reports to round out the real estate picture... even though they're only as-of August. Both the Case-Shiller report and the FHFA Housing Price Index will be posted on Tuesday. Clearly prices have been the shining star element for the real estate business. But, perhaps that star is burning too brightly.
Home Price Charts
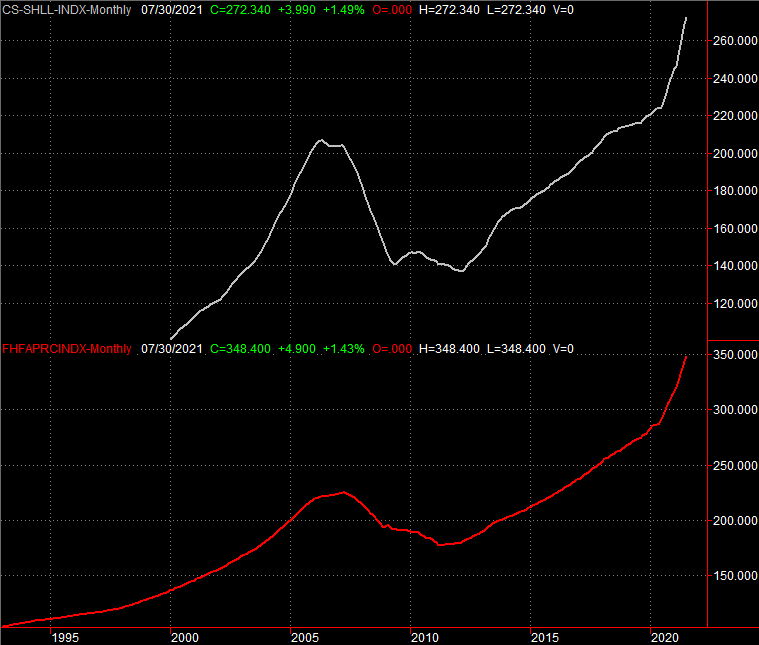
Source: Standard & Poor's, FHFA, TradeStation
It's also an important week for consumer sentiment. The Conference Board's consumer sentiment data for October will be published on Tuesday, while the third and final look at the University of Michigan's sentiment measure will be reported on Friday. Both are expected to slide a little lower from September's levels, extending what have turned into rather dramatic plunges.
Consumer Sentiment Charts

Source: University of Michigan, Conference Board, TradeStation
Stock Market Index Analysis
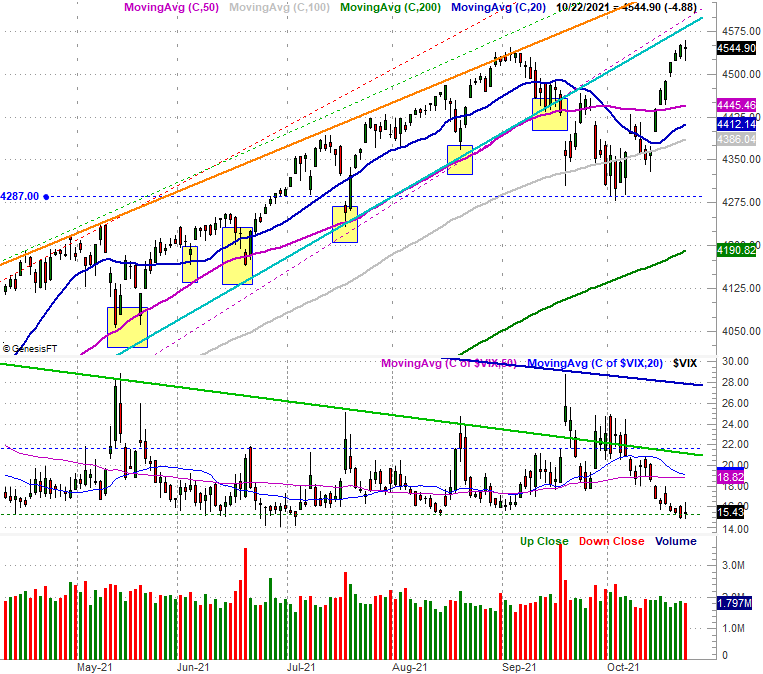
We'll start this week with a close look at the daily chart of the S&P 500; it speaks volumes. Namely, notice how the rally that got going three weeks ago was slowing down as the week wore on, and came to an outright halt on Friday.
S&P 500 Daily Chart, with VIX and Volume
Source: TradeNavigator
Also notice the shape of Friday's bar. It's a doji, meaning the open and close are essentially the same value, and in the middle of a relatively tall bar (a big low-to-high range). This is a hint of the equilibrium... in transition from a net-buying to a net-selling environment.
The daily chart of the NASDAQ Composite looks similar, although not identical. Namely, Friday's bar for the composite isn't a doji. It's a clear pullback, with a loss from the open to the close as well as a loss for the day, in addition to a lower low-to-high range compared to Thursday's trading range. In total, it's another hint that the rally is losing steam if it's not out of steam already.
NASDAQ Composite Daily Chart, with VXN
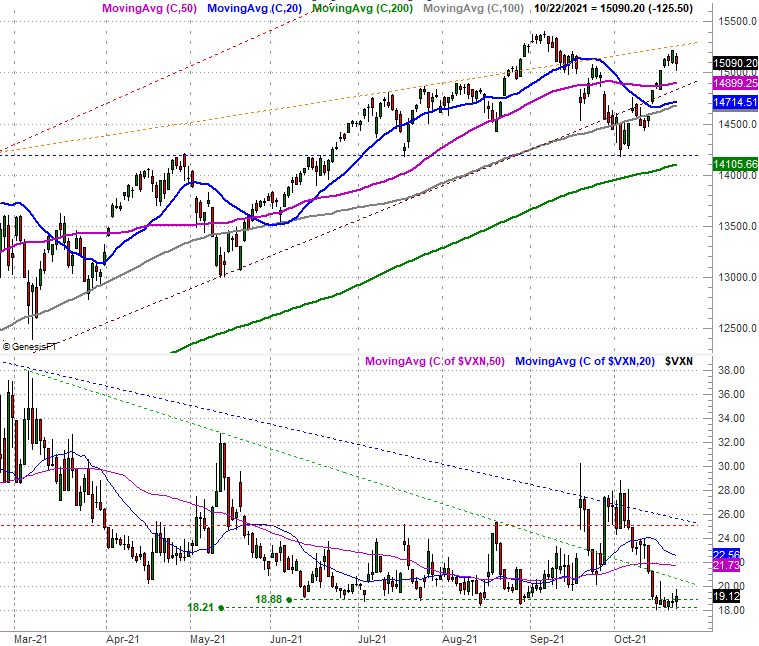
Source: TradeNavigator
Zooming out to the weekly charts adds perspective to the discussion. Take a look at the S&P 500's. The strength of the rebound effort is clear from this vantage point, and even with Friday's lull, last week's bar is pretty impressive. The index gained another 1.6%, and still closed near its high for the week.
S&P 500 Weekly Chart, with VIX and Volume
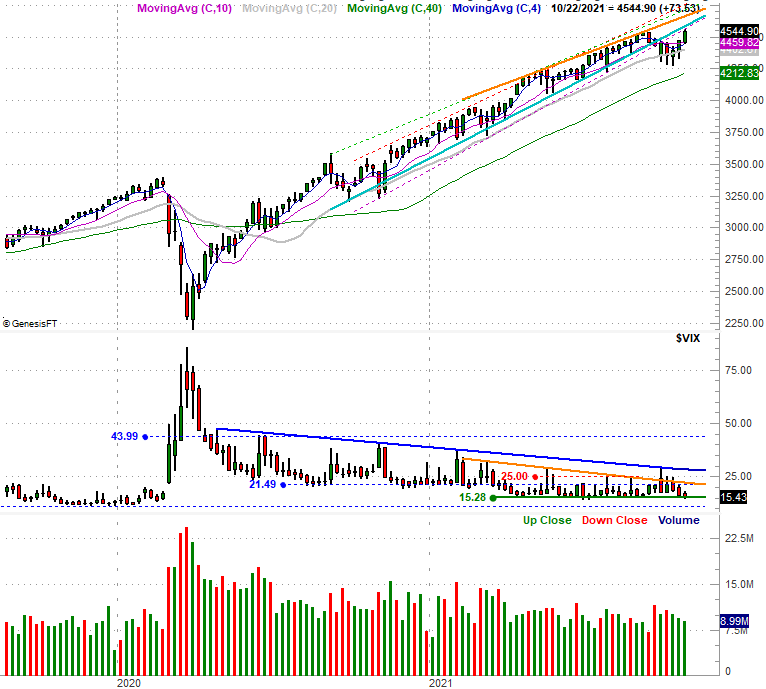
Source: TradeNavigator
Also notice, however, the volume this three-week gain for the S&P 500 has also been waning the whole time.
The NASDAQ's weekly chart's got its own problems. Last week's high took shape when the index bumped into a technical ceiling (orange) that materialized back in July. Granted, the composite briefly pushed that resistance in September. That doesn't mean a technical ceiling can't remain in play once it's been breached though.
NASDAQ Composite Weekly Chart, with VXN
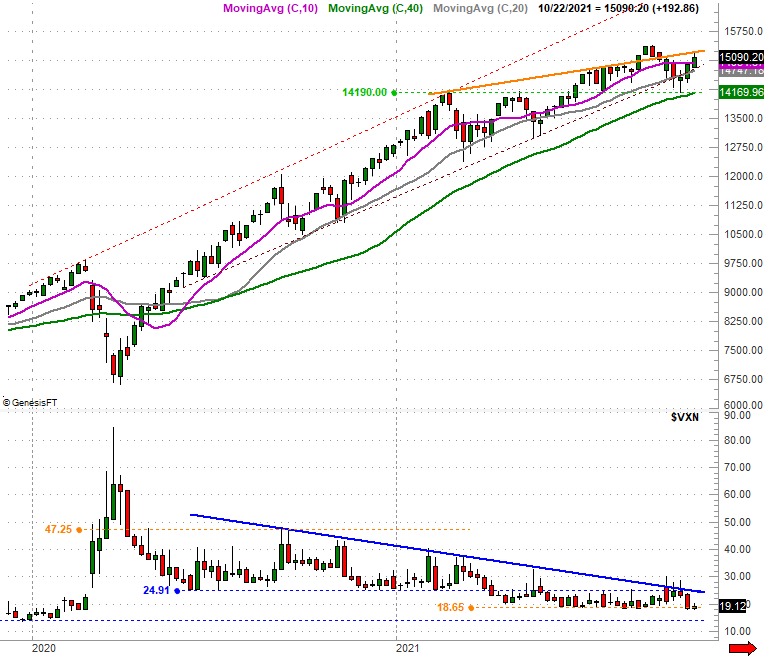
Source: TradeNavigator
Both the S&P 500's and the NASDAQ's volatility indices would need to punch through their recent technical ceilings as well before presuming stocks are entering meltdown mode.
The undertow is still bullish, so we won't be making any bearish assumptions here. We'll simply mentally prepare for the possibility. There's room for a pullback without breaking the uptrend. The S&P 500 could peel all the way back to the 4440 area before "too much" damage is done, while the NASDAQ could pull all the way back to the 14,715 area and still remain in an uptrend. In fact, a slight lull here might be the best thing for the bulls, cooling off an overextended market before stocks race so high that any pullback will easily turn into a full-blown corrective move.