Weekly Market Outlook - The Bulls Continue to Shrug Off the Danger
For a holiday-shortened week, the bulls got quite a bit done. Despite Friday's 0.41% setback, the S&P 500 mustered a 1.0% advance for the four-day stretch, halting the previous week's hint at a beginning of a pullback. Better still, stocks tiptoed a little deeper into record high territory.
Still, the market is overbought and seemingly ripe for a step back. It's just the wrong time of year for one, even if the backdrop is right.
We'll weigh the right and wrong against one another below -- as always. First, however, let's recap last week's big economic announcements and preview this week's releases.
Economic Data Analysis
Consumer sentiment is... still not quite what we wish it was. The Conference Board's measure fell a little bit last month, and came up short of expectations. The University of Michigan's reading improved a little. In both cases though -- and on average -- is just holding steady, indicating consumers/traders are largely on the fence.
Consumer Sentiment Charts
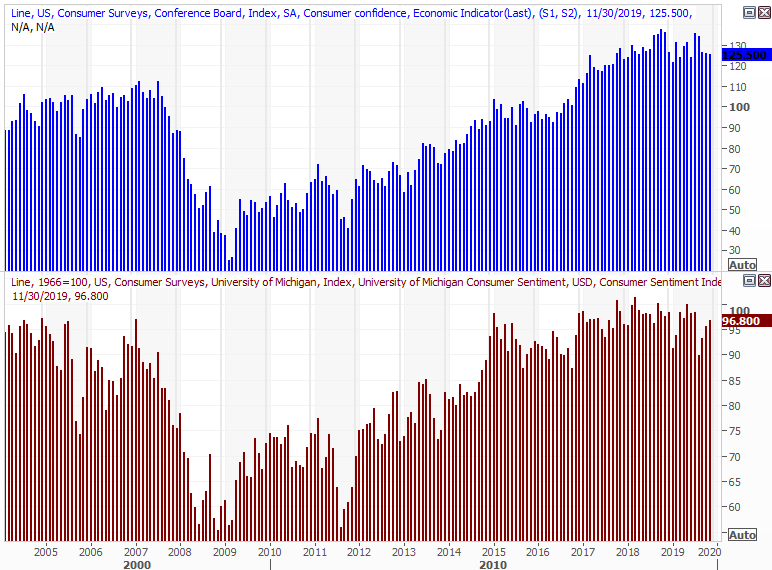
Source: Thomson Reuters Eikon
Consumers are feeling a little better about real estate purchases though, with home prices rising in September at a faster pace than seen in August. The Case-Shiller Index didn't quite reach expectations, but there's still a fair reason for hope on this front.
Home Price Charts

Source: Thomson Reuters Eikon
Lastly, the second estimate of the second quarter's GDP growth rate was revised upward... by more than a little. It improved from 1.9% to 2.1%. There's still one more potential update to go, but the second look is usually close to the third.
GDP Growth Charts
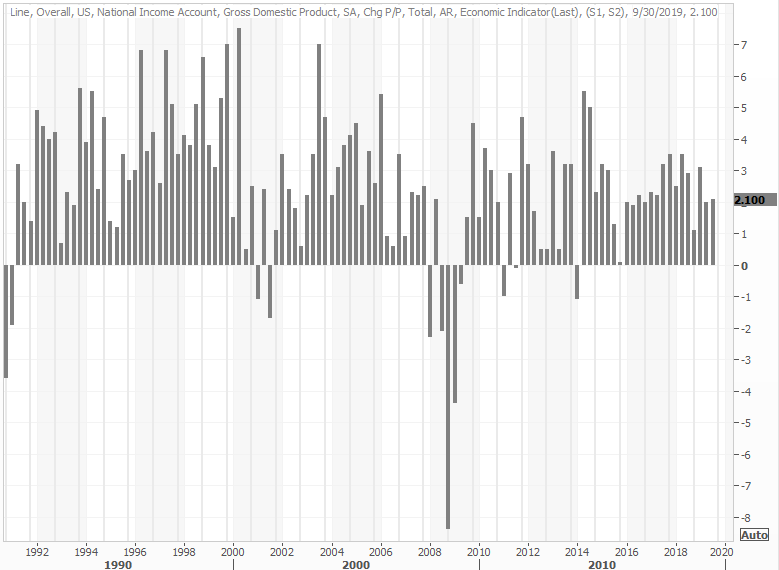
Source: Thomson Reuters Eikon
Everything else is on the grid.
Economic Calendar

Source: Briefing.com
This week is a pretty busy one, though there's only a couple of data sets we're terribly interested in.
The first one is the ISM Manufacturing Index reading for last month, due on Monday. Economists have projected a slight improvement, from 48.3 to 49.2. The industrial sector didn't show any real earnings growth strength for Q3, but an uptick here would be a pretty big victory for the overall scenario. We need a victory here too, as we will next week with the services side of the data.
ISM Index Charts

Source: Thomson Reuters Eikon
This week's highlight, of course, will be Friday's jobs report... the one reliably encouraging glimpse at the economy's strength. The pros are looking for continued strength, forecasting 175,000 new payrolls were added last month following October's 131,000. That still won't be enough to alter the unemployment rate of 3.6%, but that rate is still monumentally low.
Payroll Growth and Unemployment Rate Charts
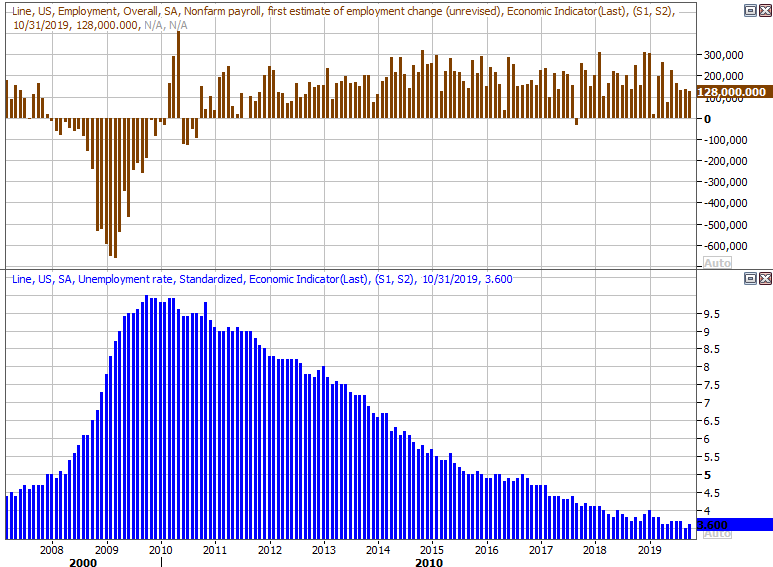
Source: Thomson Reuters Eikon
As usual, we'll take a detailed look at the jobs report at the website, exploring the rest of the numbers the media didn't look at.
Stock Market Index Analysis
Since its early October low, the S&P 500 has rallied roughly 10%. It's made bigger, uninterrupted moves, though not all that often. It's also now 7.3% above its 200-day moving average line (white) at 2927.16... another unusually large divergence. The oddly low VIX isn't working to the market's bullish advantage either.
S&P 500 Daily Chart, with VIX and Volume
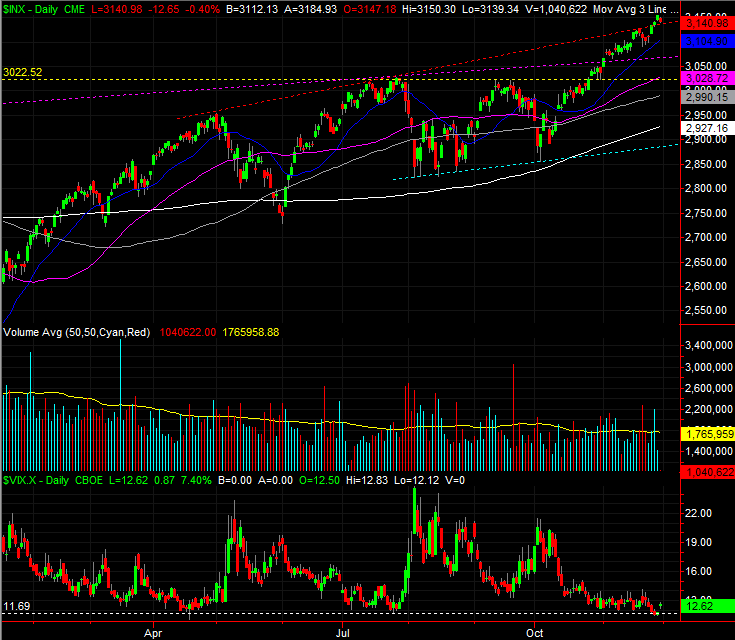
Source: TradeStation
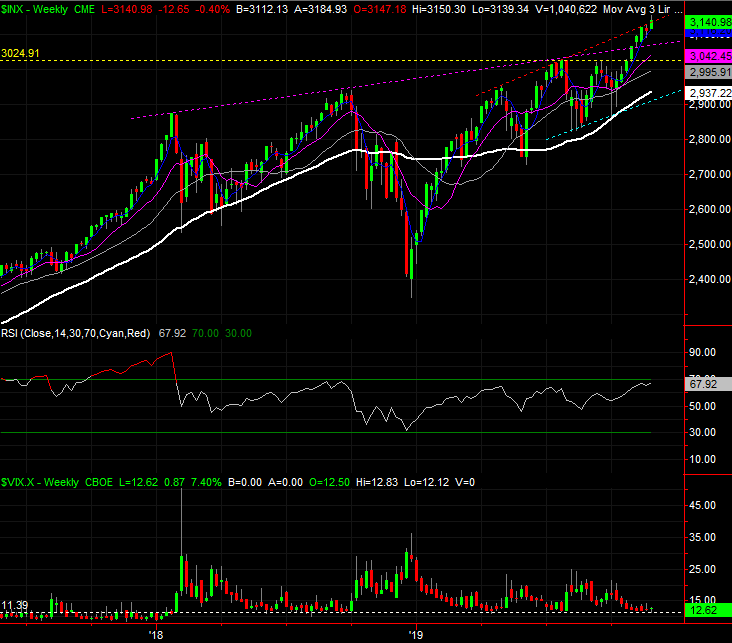
Zooming out to the weekly chart doesn't give us any new information, but it does give is some additional perspective on just how far the past eight weeks have carried us into new-high territory. Granted, we started with the advantage of a hairy selloff during the fourth quarter of last year. Nevertheless, the 10% advance since the beginning of October means the S&P 500 is now up nearly 34% since late-December of last year. The weekly chart, to that end, notice the weekly chart's RSI indicator line as now at its highest value since early 2018, after an amazing 2017 runup.
S&P 500 Weekly Chart, with VIX
Source: TradeStation
It doesn't seem to matter yet. Traders are pretty convinced the Federal Reserve and the White House are going to keep the economy moving, with the latter seemingly moving toward some amicable cooling of the trade and tariff war. But, the result of that optimism isn't backed up by the market's current or forward-looking valuation. As of the latest tally, the S&P 500 is trading at a trailing P/E of 20.6, and a forward-looking one of 18.5. Both are above average.
S&P 500, With Earnings and P/E, Past and Projected
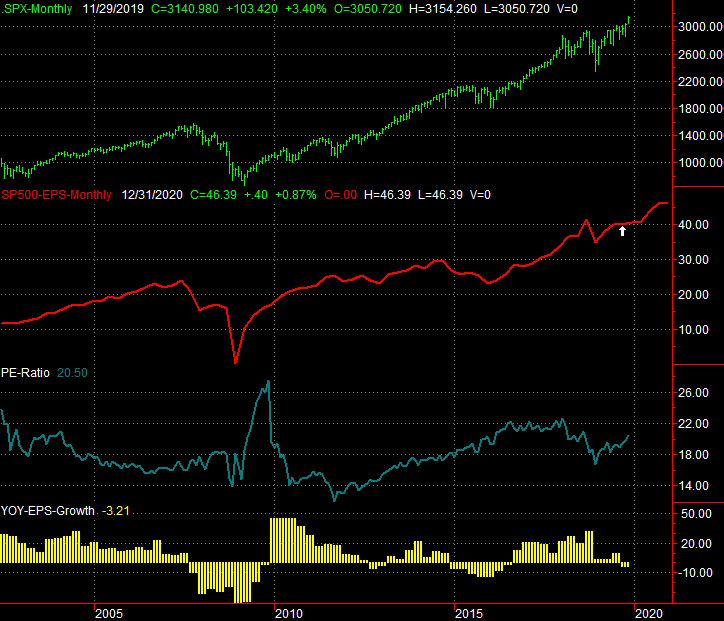
Source: TradeStation
The energy sector has weighed a little on overall earnings, though doesn't account for the bulk of Q3's slight, 3.2% income lull. Telecom, tech, and industrials were sore spots for the market, and the latter two needed to be significant help (even if only to set a tone of optimism). The valuation matter only underscores the risk of a correction here, but again, that only matters if traders choose to care.
We'll have to assume the current advance will remain in motion until we have clear reason to think it won't. And, the first thing that will have to happen is the S&P 500 crossing back under its 20-day moving average line (blue) currently 3105. Even then though, any of the other moving averages below that line could -- and likely would -- act as a support level. Any break below the S&P 500 under its 20-day moving average line would also coincide with the VIX moving above this month's ceiling around 14.1.
The most absolute floor for the S&P 500 right now remains the line that connects August's and October's low, marked as a light blue dashed line. The VIX has a corresponding ceiling around 21.5.
Whatever's in the cards, just don't dig in too deep right now on either side of the fence. This remains a news-driven and sentiment-driven environment.