Weekly Market Outlook – The Bullish Train Is Chugging Along. It May Even Be Unstoppable.

Not every day was a winner last week. In fact, Wednesday was a decided loser after traders panicked over the Fed’s decision to dial back its dovishness. (That is to say, a spate of interest rate cuts isn’t a foregone conclusion.) Once they had a chance to regroup though, Thursday’s and Friday’s buying carried to the S&P 500 to yet-another record high close. And, the undertow is still bullish.
All the same, there’s good reason to keep your optimism in check. While stocks backed away from their risk of a pullback -- at least for now -- all the key indexes are testing near-term resistance levels.
We’ll take a look at those technical ceilings in a moment. Let’s first run through last week’s top economic announcements and preview what’s coming this week.
Economic Data Analysis
It was a pretty big week, with things kicking off in a big way on Tuesday with updates on home prices. Not surprisingly, it seems like they’re (finally) starting to wane. The S&P Case-Shiller Index fell a bit on a sequential basis. The FHFA Home Price Index didn’t, but like the Case-Shiller Index, it’s still showing something of a slowdown. This was more or less inevitable in light of mostly-weak unit sales. (Although not shown here, bear in mind that sales of existing homes are at a multi-year low, while new home sales are also still pretty anemic.)
Home Price Index Charts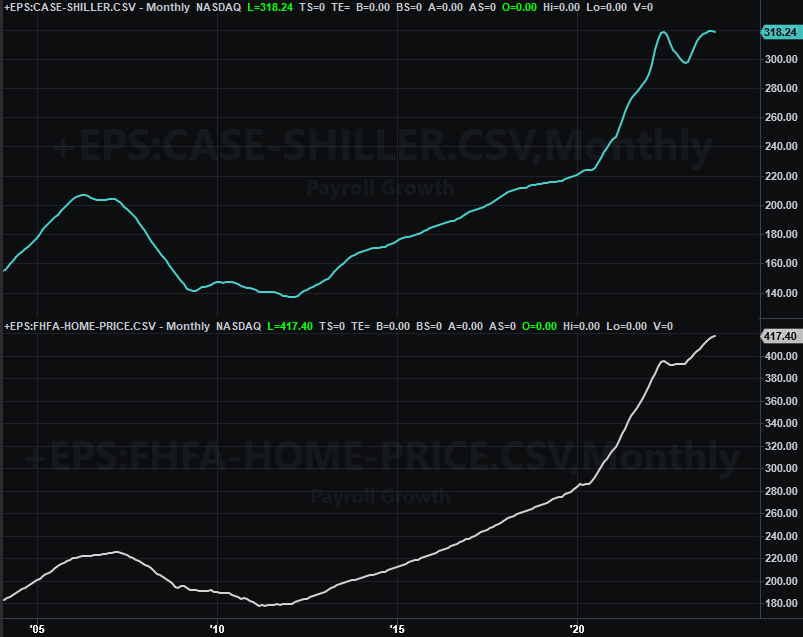
Source: Standard & Poor’s, FHFA, TradeStation
Tuesday’s report on consumer confidence -- from the Conference Board -- was mostly good. Although it came up a little short of expectations, the reading of 114.8 is a marked improvement on December’s 108.0. We also heard the University of Michigan’s sentiment index score for January on Friday, and it was up even more from its December level. This of course bodes well, and explains what might have otherwise been a surprising week of continued bullishness.
Consumer Sentiment Charts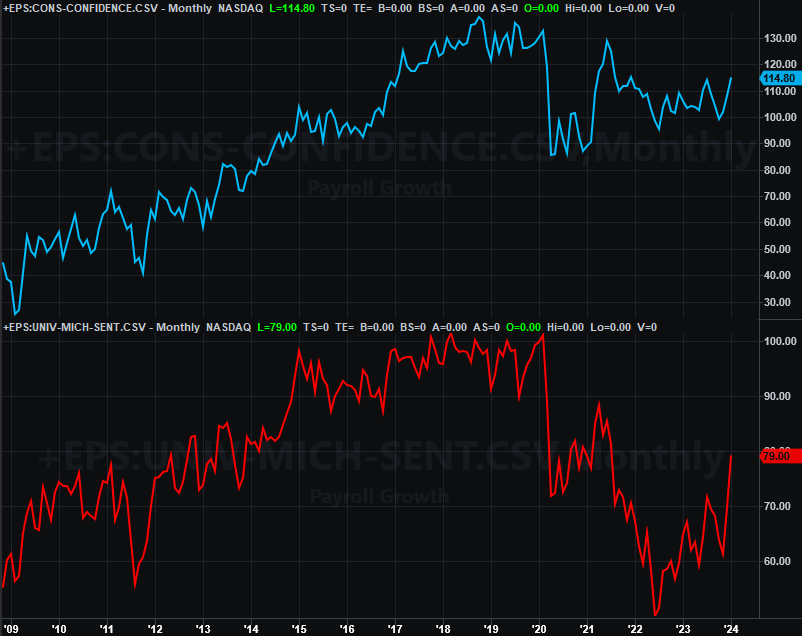
Source: University of Michigan, Conference Board, TradeStation
On Wednesday we heard from the Federal Reserve regarding interest rates. Long story made short, the FOMC didn’t cut interest rates this past week, and doesn’t appear to be in any real hurry to do so (contrary to most expectations). More optimistic consumers certainly makes it easier for the Fed to hold off on rate cuts.
We also heard January’s jobs report on Friday, which may further partially explain why the Fed’s feeling a little confident in its call to leave rates alone. Although Wednesday’s ADP Employment numbers suggested job-growth was anemic last month, the Bureau of Labor Statistics’ look at the numbers on Friday were actually encouraging. The country added 353,000 new jobs last month versus initial expectations of only 185,000. Just as good is the fact that December’s figure was revised much higher. That was enough to prevent the unemployment rate from ticking up from 3.7% to 3.8%.
Unemployment Rate, Payroll Growth Charts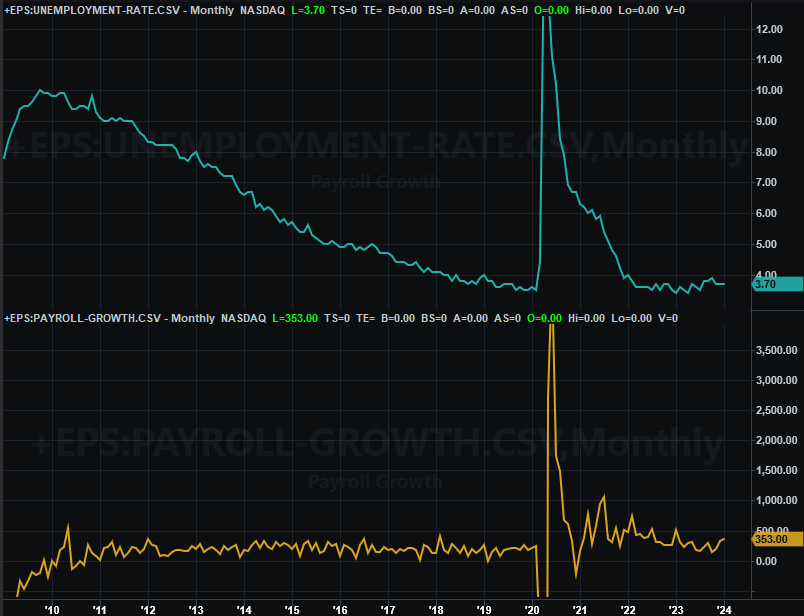
Source: Census Bureau, TradeStation
Everything else is on the grid.
Economic Calendar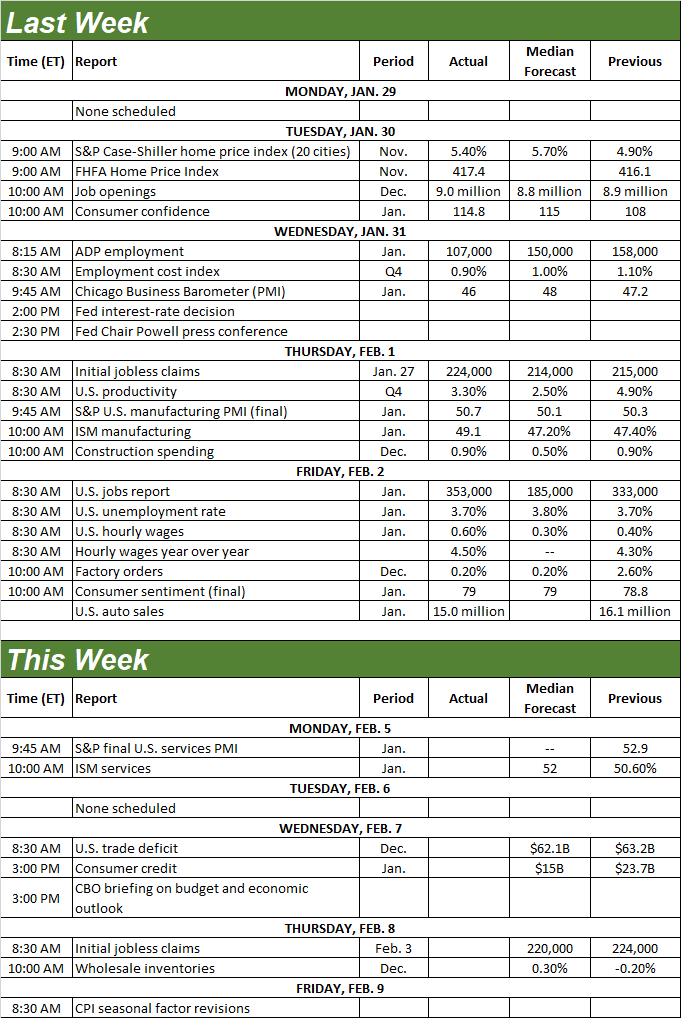
Source: Briefing.com
The only item of interest on the schedule for this week is Monday’s services index update from the Institute of Supply Management. The manufacturing version of this index was posted last week, growing slightly from December’s value, and even offering hope that a recovery from 2022’s plunge is truly underway. Still, the number’s below the pivotal 50 level. Economists expect the services index to have moved higher as well, even further above the 50 level it’s already holding above. Just note that the services index is still in a bigger-picture downtrend, and will remain in one even if the numbers pushes a little higher for January.
ISM Services and Manufacturing Index Charts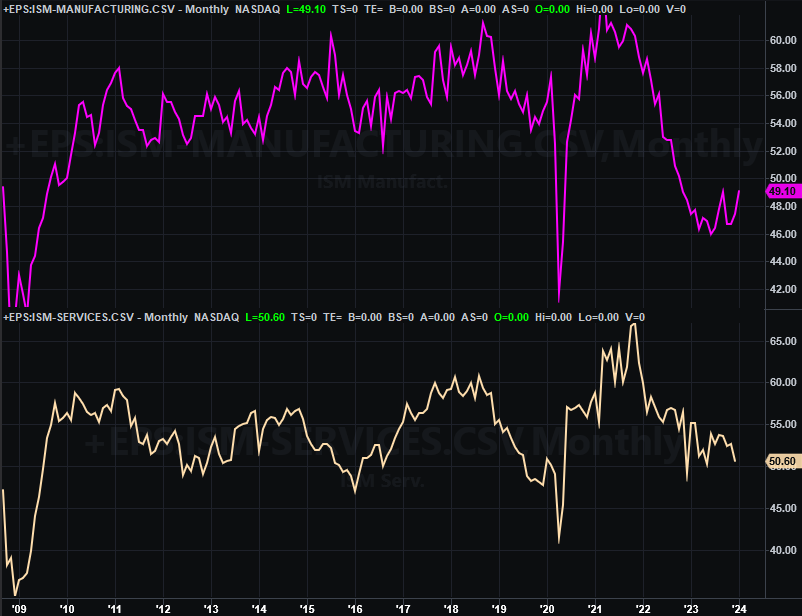
Source: Institute of Supply Management, TradeStation
Stock Market Index Analysis
Just as scripted, the S&P 500 managed to keep chugging higher last weeks. That’s the fourth straight week of gains, and the third one following the point where the index finally punched through its previous peak at 4,811 -- that’s a breakout trigger. Of course, this bullishness is still ultimately the result of a cup-and-handle breakout that took hold when the S&P 500 broke above the brim line at 4,600 back in the middle of December. Also notice on the weekly chart below that the volume behind the current leg of the rally is actually taking shape on above-average and growing volume.
S&P 500 Weekly Chart, with VIX and Volume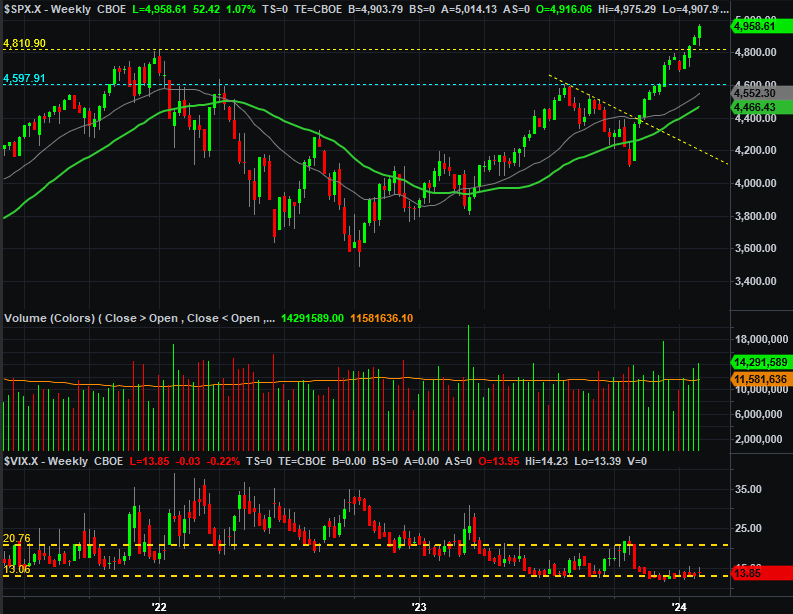
Source: TradeNavigator
The weekly chart of the NASDAQ Composite looks about the same, although with one noteworthy difference. That is, the composite hasn’t yet moved above its late-2021 high of 16,175. The cup-and-handle breakout above the brim line at 14,439 is still getting clear traction though, and like the S&P 500, technical support below the NASDAQ is firming up.
NASDAQ Composite Weekly Chart, with VXN and Volume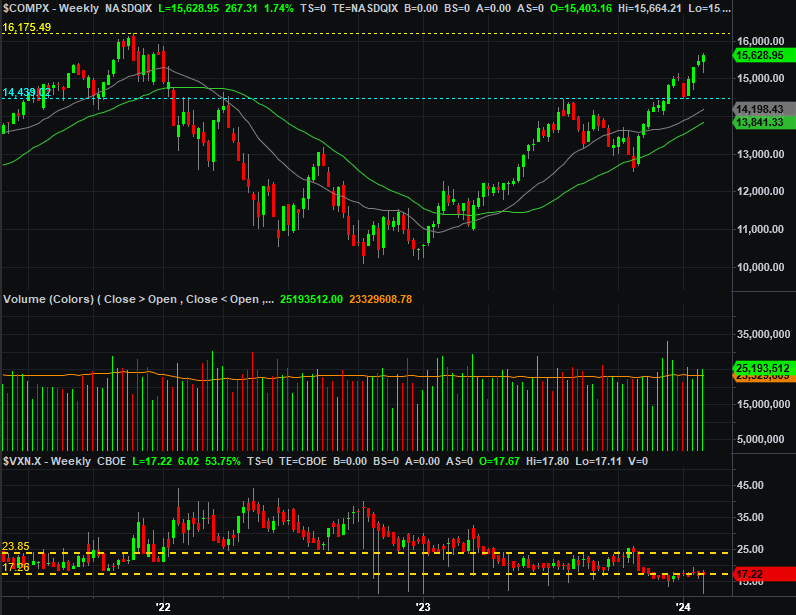
Source: TradeNavigator
The thing is, both indexes may well need that support sooner than later… not that the bigger-picture rally is under any real serious threat.
Check out the daily chart of the S&P 500 below. The gains logged in the past two days of the week were solid, but the effort stopped right when a short-term technical ceiling was encountered… the line that connects the key peaks going all the way back to mid-December (orange, dashed). This points to a slowdown or even perhaps a pullback from here. Fortunately for the bulls, it doesn’t have to mean a devastating pullback is in the cards. The buying volume is picking up, after all, and there’s lots of technical support below. It just means the bullish path ahead is far from being already blazed.
S&P 500 Daily Chart, with VIX and Volume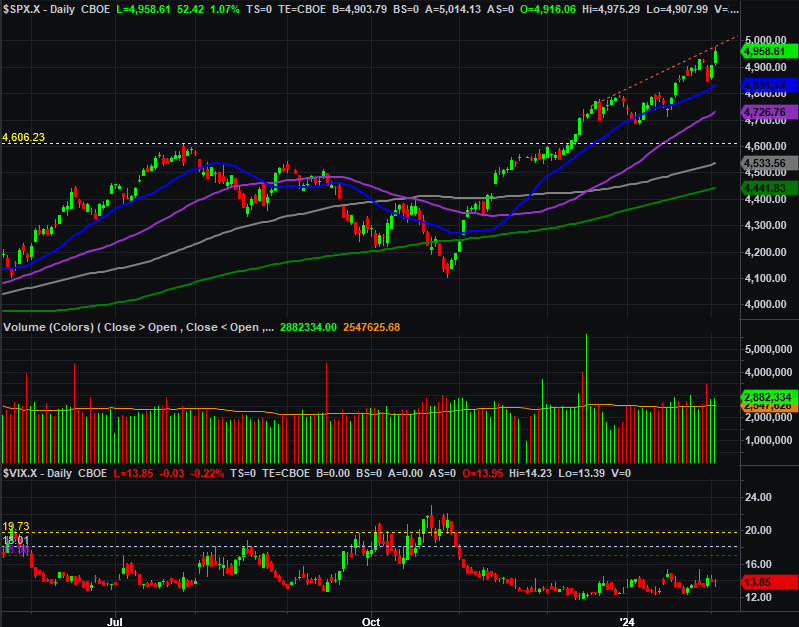
Source: TradeNavigator
And the daily chart of the NASDAQ Composite looks about the same. That is, there’s a clear resistance line now forming (orange, dashed) that connects all the highs going back to October. The one curious difference? The volume behind this multi-week gain is now waning.
(orange, dashed) that connects most of the key highs going back to November.
NASDAQ Composite Daily Chart, with VXN and Volume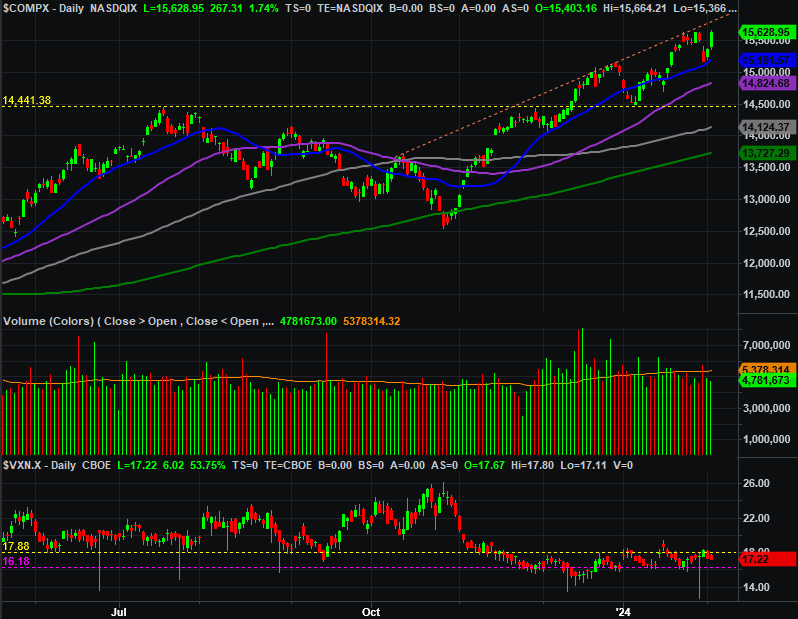
Source: TradeNavigator
Still, there’s tons of technical support below… like all of the index’s key moving average lines. Any weakness from here should be minimal at best.
Bottom line? The market’s up on the order of 20% just since October’s bottom. That’s a lot of ground to cover in a short period of time. That’s working against the current rally. The good news is, there’s room for a cooling-off pullback without breaking the bigger-picture rally. We’ll count on that until we clearly can’t any longer. Just know it would take a lot to break this rally’s bigger-picture bullish stride.